The use of an email marketing tool is not based solely on the sending of promotional campaigns, but the tool becomes an excellent instrument for achieving one or several goals.
According to the latest report by Demand Metrics, the three principal reasons why users decide to do email marketing are:
- Communicate with customers
- Communicate with prospects
- Build brand awareness
There are also other reasons like generating revenue or capturing data on subscribers, and just 3% of the users do not have any goal.
Do you know your email marketing goal?
Having a goal is crucial to building your whole email marketing strategy.
How should you read your first email marketing report?
When you are on the report page, you will find a summary of the outcome of the campaign:
With numbers alone, it is difficult to see what happens. However, just below the numbers are changed to percentages from which we can get better insights:
This chart is fantastic to get an idea about the campaign performance and to start planning the measures we need to take in our next campaign.
In this case, and to best situate yourself, these results belong to an information campaign that was composed of a logo plus the text. It was sent to a database compiled since 2017 and updated every day. Let’s start to analyze the results:
- OPEN RATE: it is very good. We can determine that the campaign has been useful. It reached the 33%. We should work to reach the 35% next time.
- BOUNCE RATE: it is just within the limits. This rate should never be higher than 2%, and if possible, it should be lower than 1%. In this article, Want To Start List Hygiene, But You’re Afraid To Start? We give you the key steps you should follow to get a bounce rate of one percent or less.
Then, we have:
CLICKS INTERACTIONS measure the percentage and the number of subscribers that have clicked on your links. If we click on the number, we will be able to see the name, email address, and date of click.
In this case, the campaign did not have any link to click, except the one in the logo, that’s why the click-through rate is too low. This click-through rate is calculated based on opens.
It is difficult to know the click-through rate that can be considered as good because it depends on the goal of the campaign (informative o sales) and the design (if we use links, CTAs, etc.). If the goal is that the subscriber clicks, that percentage never should be lower than 1%. Otherwise, we should rethink the content or the design.
This part also offers us the possibility to know on which links the user has clicked and how many times.

Also, you have a CLICK MAP that shows you like a hot map where the subscriber has clicked:

We also have the number and the percentage of the UNSUBSCRIBES, and if you click on the number, you will see the reasons:
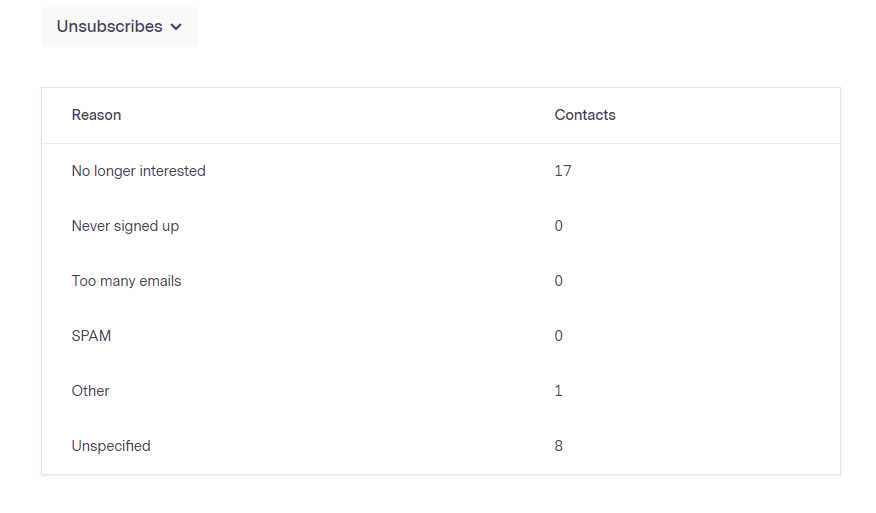
Knowing the reason is interesting, because in the case of a high number of unsubscribers sharing the same reason you may understand that there is something you’re not doing well.
It is usual that some people lose the interest in your product or information, but if you see that this percentage surpasses 1% on a regular basis, that can give you a signal that the content is no longer relevant for them or that maybe you should change the frequency of the sends.
The ABUSE RATE is also important data to keep in mind because it measures the number of subscribers that have marked your campaign as spam. Again, if you click on the number, you will see the report:
Even, if it is a double opt-in list, you may have a spam complaint, for example, when you have sent a campaign to that database, and a subscriber does not remember to have signed up for it. If you have more than one isolated complaint, you should review the process of obtaining your subscribers, because it indicates that they are not expecting to receive your emails.
This report gives the contact data of the subscriber who has marked you as spam. In Benchmark, we always recommend to include these links…
…to allow the user to exercise his/her rights, and in particular, the link “Report Abuse” that gives the subscribers the chance to mark you as spam. Removing it from your campaigns is preventing yourself from getting valuable information. In this blog, How Do Abuse Complaints Affect Your Newsletter’s Deliverability? We tell you what you should do to avoid abuse complaints.
And finally, the FORWARDS RATE tells you how many times your campaign has been forwarded to a user who was not on your list. This rate only counts when subscribers have used the “Forward Email” link in your campaigns, so if you don’t include it, the percentage will be 0.
At the bottom of the report, you will find the HOURLY PERFORMANCE:
This is a great chart to know the days and hours that work better to send your email marketing campaigns. For example, this campaign was sent on Friday, June 22nd at 7.30 AM, so if we read the graphic, the subscribers are active on Saturday, 23th at 10.00 AM or Monday 25th at 7.00 AM which, we guess is when many of them login in their inbox for first time to start the working day.
It is fantastic to have this information and sending the next campaigns based on the suscribers’ behavior guarantees you a higher engagement.
If you shared your campaign on social media channel, you could see the interactions that the users have made on the channel with your post under FACEBOOK ENGAGEMENT.
Also, you have an interactive map where you can see the OPENS BY GEOLOCATION:
If you send to various countries, this report can be interesting for you, although you need to keep in mind that this information is an estimate and may not be as reliable due to the way ISPs distribute IP addresses.
All this information can be downloaded as a PDF or Excel, and you can share the campaign with your sub-accounts, among other things:
What results should you expect from your first email marketing campaign?
Answering this question is a bit complicated because there are many factors that influence the outcome, such as:
- Old database
- Verified database
- Own database
- Recent database
- Design of the campaign
- Subject line
- Domain quality or use of public domain
- Set up of the SPF and CNAME records
- Use of a Dedicated IP
And a few more… But set yourself the following numbers as initial objectives:
- Open rate: 15%
- Bounce rate: 0.5%
- Unsubscribe rate: 0.75%
- Abuse complaints: 0.05%
If you can not reach these metrics, you can always count on the help of our Email Marketing Specialists, who will guide you with their best tips to reach them.
Now it’s your turn to start your campaigns! Would you mind to share your results with us?

Benchmark Recommends
See all articles

Mastering Email Marketing Without Overwhelming Yourself: A Guide for Busy Marketers

How to Make Your Social Media Efforts Compliment and Amplify Your Email Marketing