Return Path announced this year’s annual benchmark report and it is very important to gain perspectives to boost our email deliverability.
In this benchmark report more than 2 billion promotional email messages that send between July 2017 and June 2018, have analyzed. Thanks to this research we have now 12 month global, regional, and country inbox placement results, as well as inbox placement rates by industry and the top four mailbox providers.
Before sharing the findings of this report, I want to start by describing the email path to the inbox.

Email Delivery
Through the internet, multiple servers help emails to reach their destination point. Through their journey, there occurs a decision process to determine them as they’re trustable or not. Unfortunately, a lot of emails blocked on the gateway and never reach the spam folder or inbox folder.
Also, email open rates are very important. They are calculated by email service providers. ESPs consider the number of people who open the email and dividing it by the number of emails sent that failed to reach the reader.
For example, if you sent out 100 emails, 20 bounced, and 10 were opened, you would have an open rate of 12.5%.

After passing the gateway, spam filters consider the relevancy of the content, sender reputation, and user engagement to decide whether to send them in the spam folder or inbox. For detailed information about spam folders check out How to Increase Email Open Rates.
Measuring the Inbox Placement
In this report, Return Path used two different sets of data to calculate inbox placement;
- Seed Data
- Panel Data (Consumer Data)
First of all, don’t forget that we’re talking about hundreds of mailbox providers around the world. So, numbers are huge!

Let’s start by measuring the inbox placement.
Well, seed data is used to see if seed addresses are delivered or went into the spam folder or inbox. It’s a good option to measure missing or blocked emails. Also, global or country-specific inbox placement rates are calculated by seed data.
Panel data is used for email data and real-world information. The main purpose is to understand subscriber engagement.
How about measuring engagement data? Well, the answer is, they have 2 million users in their system!
So, mailbox provider and industry-specific inbox placement are calculated with panel data in this research.
Global Inbox Placement
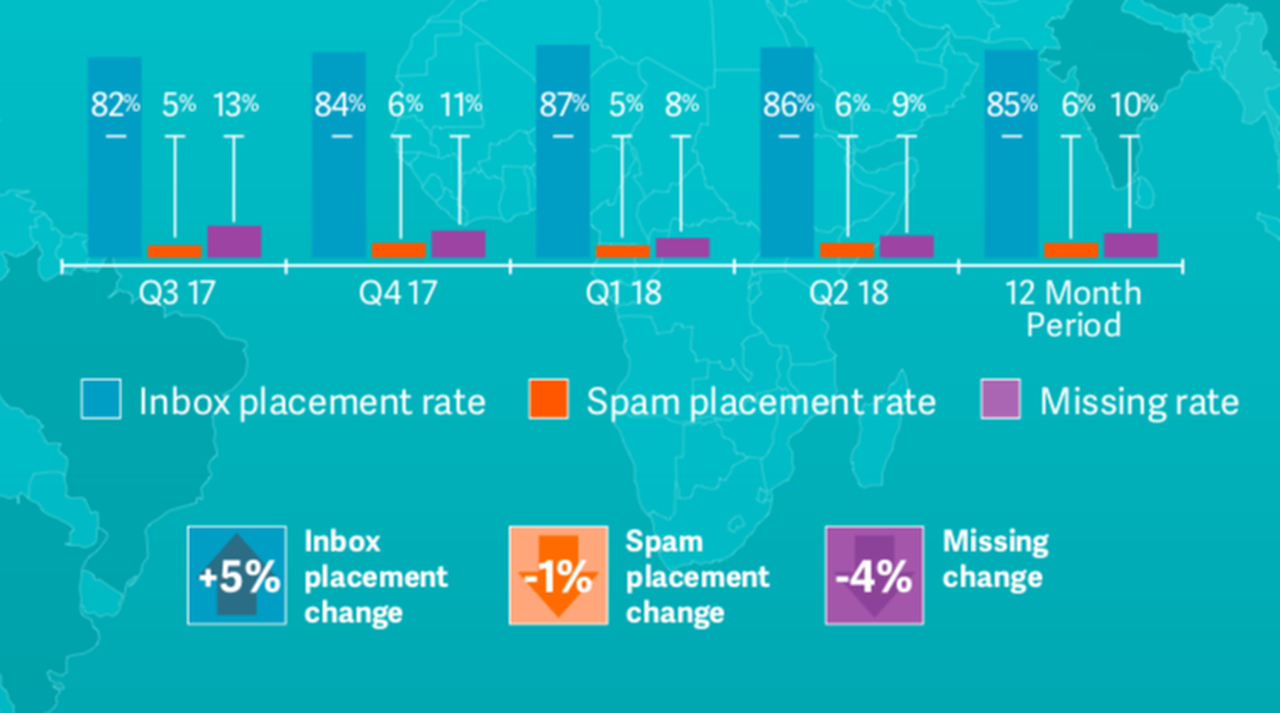
- Average global inbox placement increased by 5% points this year.
- In the second quarter of 2018, the most significant increase came in with 7% points over the same period last year.
Inbox Placement in North America

- North America deliverability was driven largely by increased inbox placement in the United States.
- Mails sent to US subscribers reached the inbox an average of 83% of the time.
- An increase of 6% percentage points over the previous period.
- The average inbox placement rate to Canadian mailboxes of 89% exceeded the global average.
Inbox Placement in Latin America
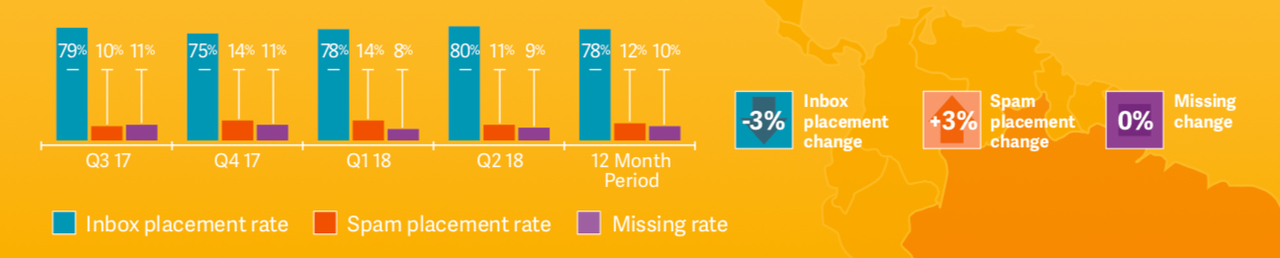
- Latin America region dropped 3% percentage points this period for an average of 78%.
- Only Mexico was able to achieve deliverability above the global average.
Inbox Placement in Europe
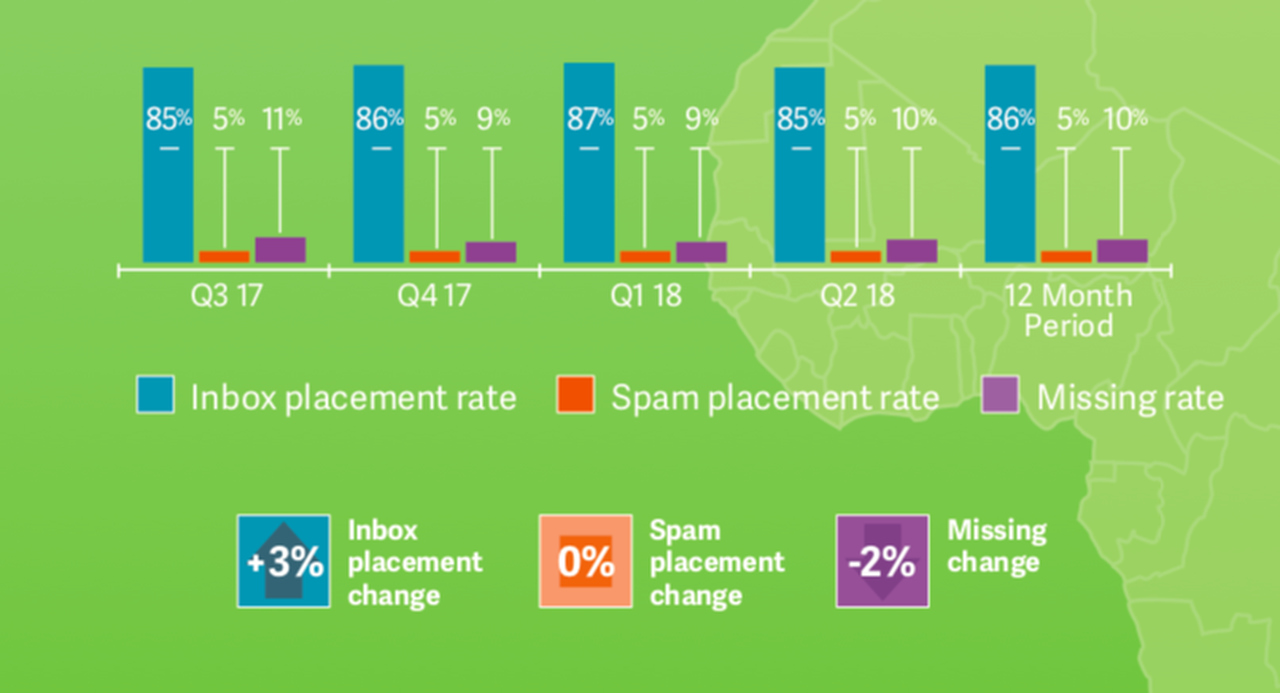
- Deliverability to European mailboxes rose slightly to an average inbox placement rate of 86%.
- Greece, Portugal, and Norway have Europe’s highest inbox placement at 93%.
- Austrian mailboxes saw the lowest inbox placement of any European country (79%).
- In Ireland, email deliverability rate increased 15% points for a new average of 92% inbox placement.
- Denmark and the Czech Republic saw the largest decline in deliverability among European countries with 3% points below the previous period.
Inbox Placement in Asia-Pacific
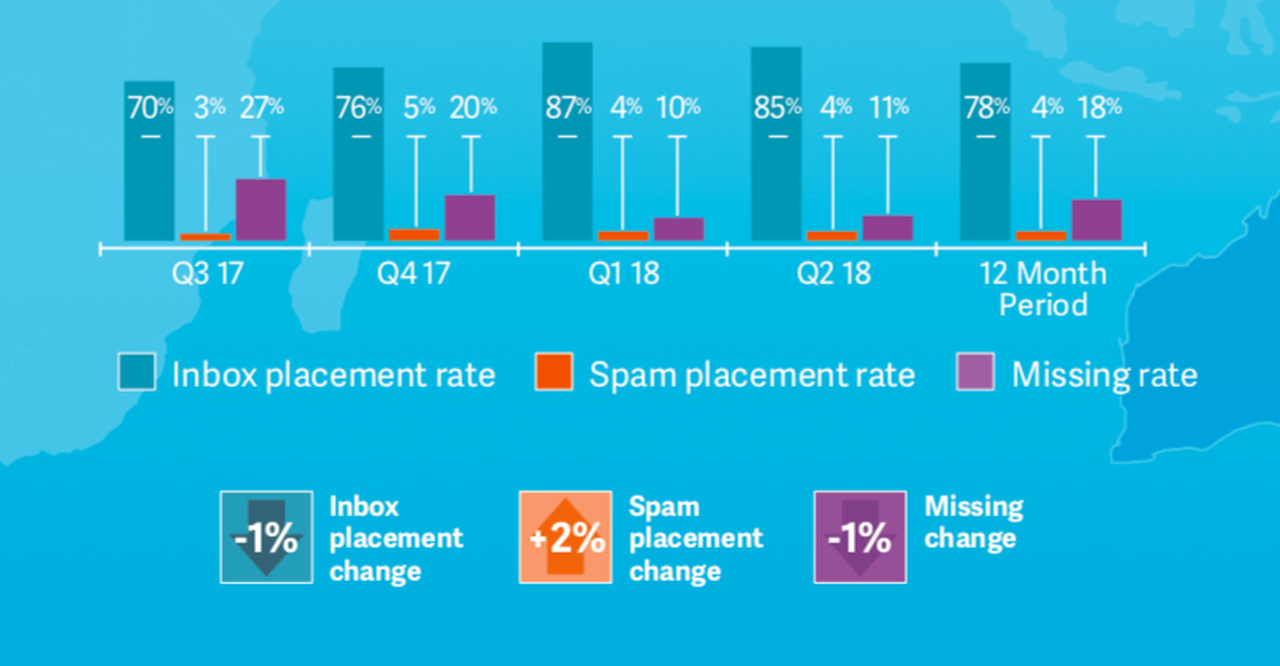
- In the previous reporting period, Asia-Pacific Region had 79% in inbox placement. This year they saw a slight decline in inbox placement with an average rate of 78%.
- Senders in mailing to Singapore and New Zealand consumers helped bring up the regional average with inbox placement rates of 90% in both countries.
- Chinese mailboxes fell far below the global average with an average inbox placement rate of just 57%.
Before jumping up the findings I should remind you that this part is calculated using panel data.
While reviewing these benchmarks, consider:
- This data shows accepted emails by the gateway. Blocked or blacklisted messages aren’t included.
- Panel data shows only the top four webmail providers: Microsoft, Google, Yahoo, and AOL.
Global Inbox Placement at the Top Four Mailbox Providers
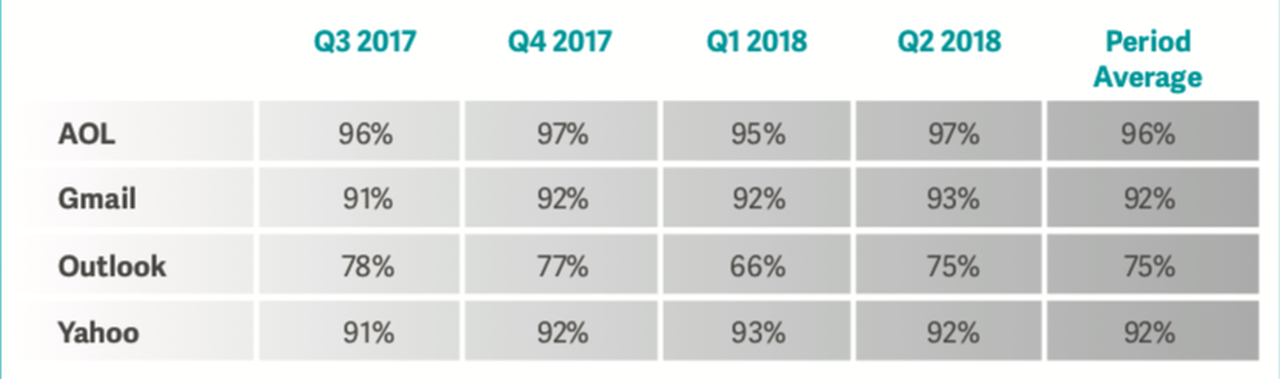
- Marketers are successfully reaching mailboxes at AOL, Gmail, and Yahoo, seeing inbox placement rates above 90 every quarter.
- Outlook was a challenging mailbox for marketers to reach with a period average of just 75%.
Inbox Placement By Industry
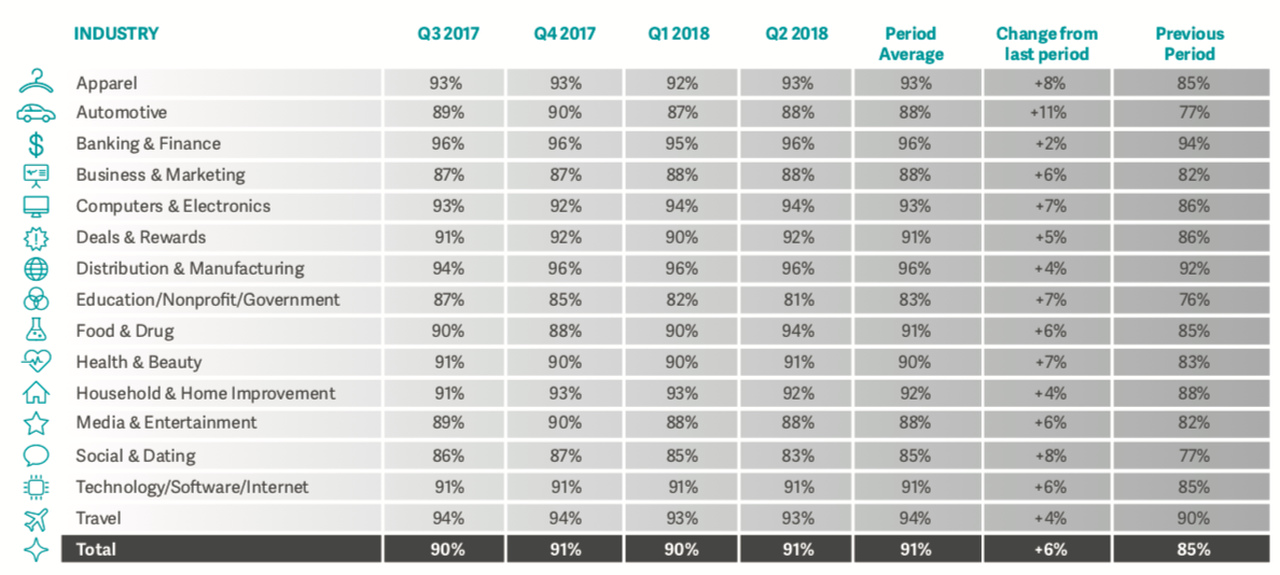
- Industry results are based on global panel data consisting of more than 17,000 commercial senders, 2 million consumer panelists, and 2 billion commercial email messages sent to Microsoft, Google, Yahoo, and AOL users in the same time period.
- Across the board, every industry saw an increase in inbox placement compared to the previous period.
- Distribution & manufacturing and banking & finance had the highest inbox placement averages for the period at 96%.
- Education/nonprofit/government had the lowest inbox placement rate at 83%.
- The automotive industry saw the largest increase in inbox placement with %88 of email reaching subscribers’ inboxes—an increase of 11% points over the previous period.
Well, we’ve covered the email deliverability benchmark 2018 in this article.
I hope you find it useful for your email marketing benefits. I’d be glad if you share your comments or additional information.

Benchmark Recommends
See all articles


Sync 2,000 Contacts with your Benchmark Account for Free