


Whether you’ve been doing email marketing for 24 hours or 10 years, understanding the important metrics in your reports is a crucial part.
I come across this question often in regards to the many features our platform offers is, “What does it all mean?” Every marketer should have a sound understanding of these factors in order to fully enjoy the fruits of email marketing.
Benchmark offers five types of reports to help marketers identify their targeted and loyal audience:
1. Email Reports
We offer real-time tracking of your email marketing and social media campaigns. It gives you the platform to understand your subscribers, clients and fans better with these analytics. Everyone likes to see high open rates and an additional increase in the traffic due to email click-throughs. Let’s also look to help understand what other metrics inform you and how you can apply it to identify your email marketing growth.
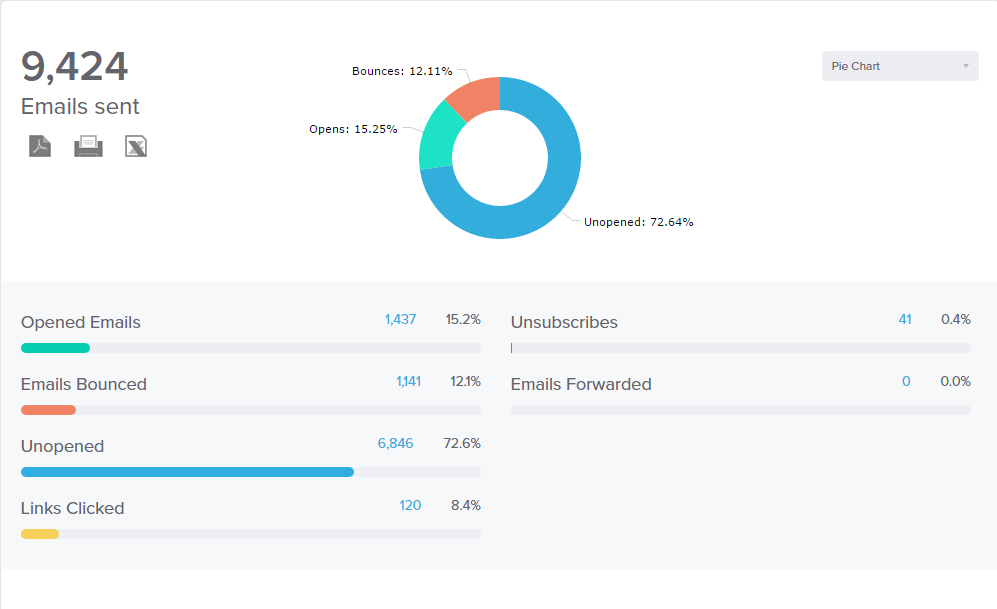
Check this report to identify how many subscribers opened your campaign and, most importantly, who clicked on what.
The basics:
Open rate: It’s pretty self-explanatory. This is the unique number of users who opened your email.
Bounces: This includes the list of users who are temporarily or permanently unable to receive your emails. The temporary bounces, aka soft bounces, are due to a full inbox or a subscriber’s service being unavailable. Permanent bounce, aka hard bounces, occurs due to fake or mistyped email IDs. Stay away from bounces, and remove hard bounces instantly from your list.
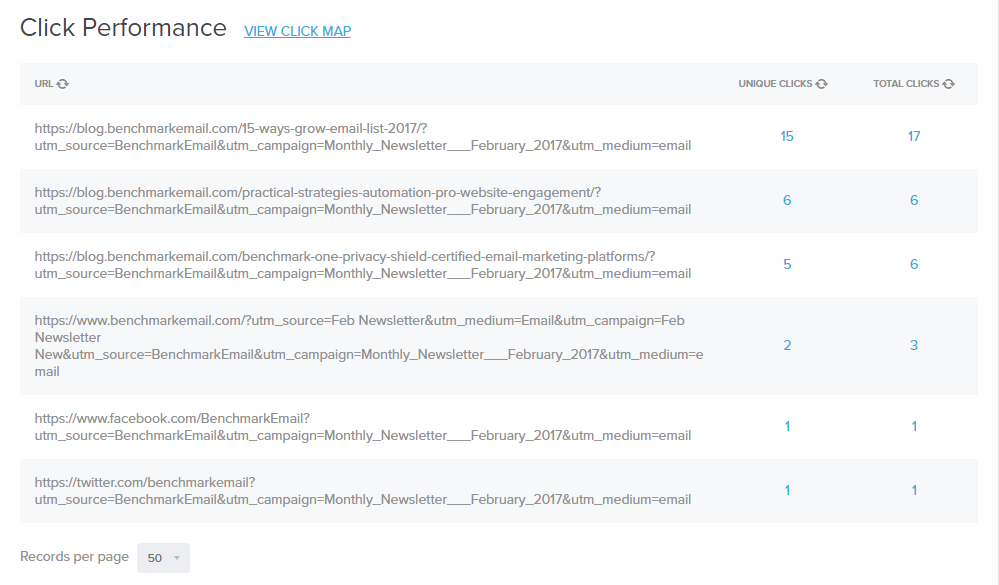
Links Clicked: Check which link in your campaign received the most clicks and which subscribers clicked those links.
Unsubscribe: This number tells you the subscribers who are no longer interested in receiving your campaigns. Make sure to update your database and refrain from sending any campaigns to them in future.
Emails Forwarded: Check this to see how many really liked your campaign and have shared with their friends and clients.
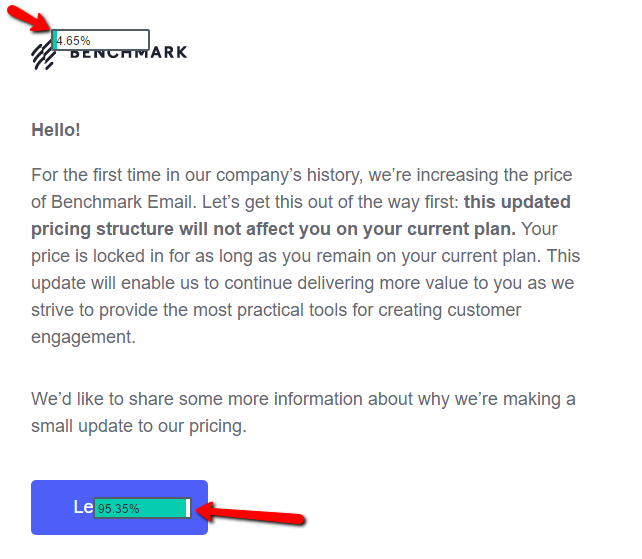
The click map feature will tell you what percentage of subscribers are clicking your call-to-action buttons. This can help you to design your next campaign with more targeted CTAs.
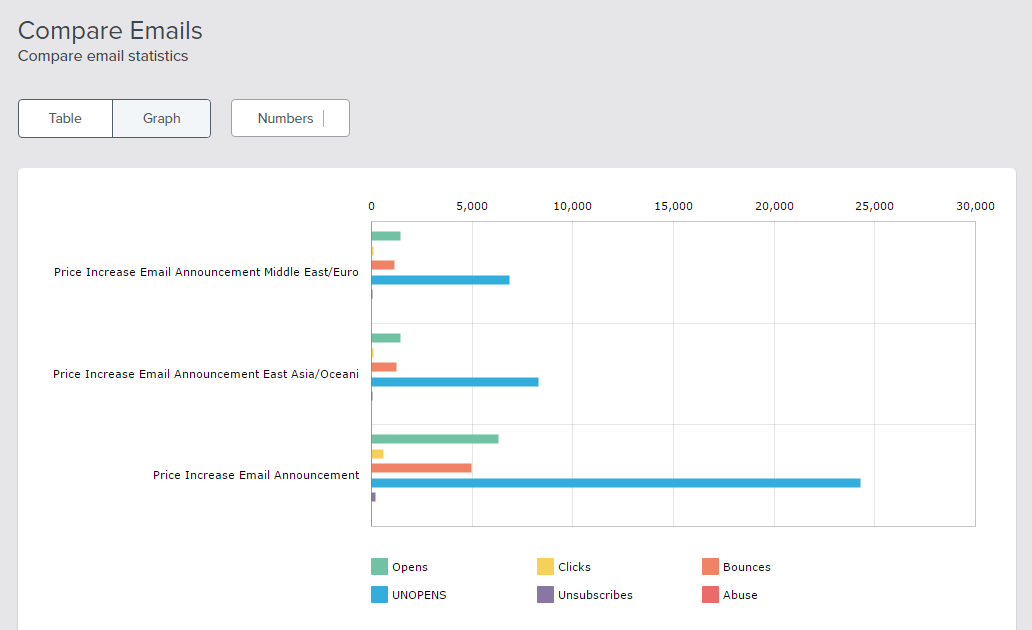
Campaign Comparison reports: This is a powerful feature that compares multiple sent campaigns on the basis of open rates, clicks, bounces, etc. This report can be helpful to understand how your subscribers reacted to your campaigns.
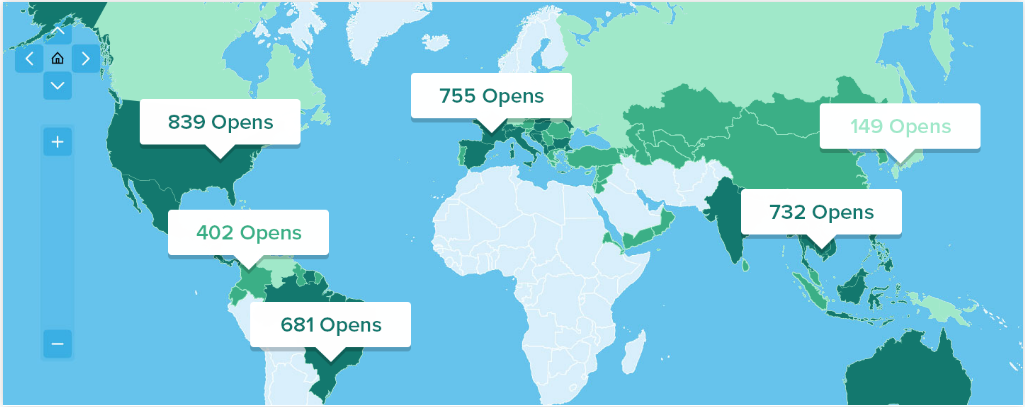
With the geo-tracking feature, you can discover where in the world your subscribers are opening your emails. Easily segment lists based on time zones to make sure your emails are always delivered at the time you want.
2. A/B Test Reports
A/B Testing is a common practice in email marketing. With a very broad audience and a lot of content, sometimes it’s hard to judge what words or style that a subscriber might like. We want the contact to like the email so that they will open the email and continue to open future emails you send to them. But what subject line should I use? What email format works better? These questions will always be on the mind of an email marketer before sending an email. The answers to those questions come in the form of A/B Testing. Not only can you test the subject line, you can also test different emails as well.
Reports of A/B Tests can be viewed under the Reports section of your dashboard. Select the A/B campaign for which you want to analyze the results. You can view the opens, bounces and forwards for that campaign.
3. Survey Reports
This unique feature helps you to learn more about your subscribers. You can ask their opinions on various subjects and company developments. Benchmark allows you to create a survey in minutes to reach your audience on any device. You can host these surveys to your domain and embed them on any web page.
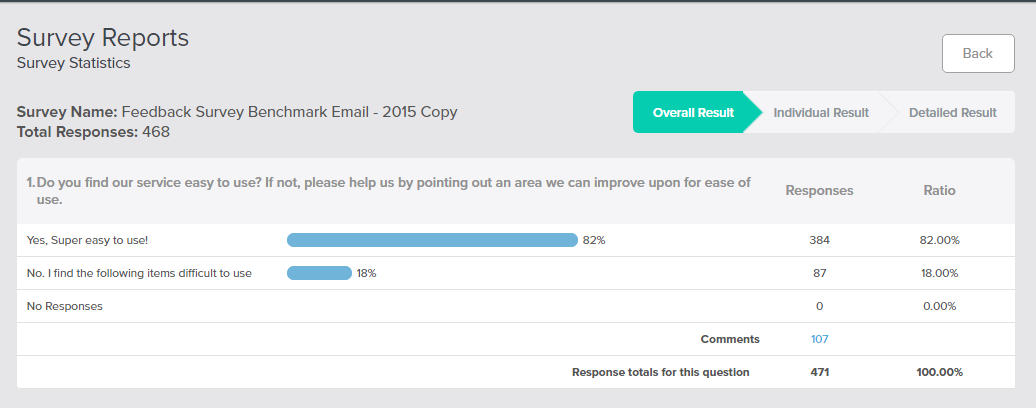
Reports of the survey created can be seen under the Reports button on the dashboard. View the responses, export it in a PDF or reuse it for a new survey. Gauge the individual as well as overall responses that can help you to be even more successful in your future business endeavors.
4. Poll Reports
Using Polls can help you discover what your subscribers like. Polls create better engagement with subscribers and your company. Similar to a survey, a poll can be distributed through your email campaigns or placed on your web page. Use a poll to find out what your subscribers want, need and like.
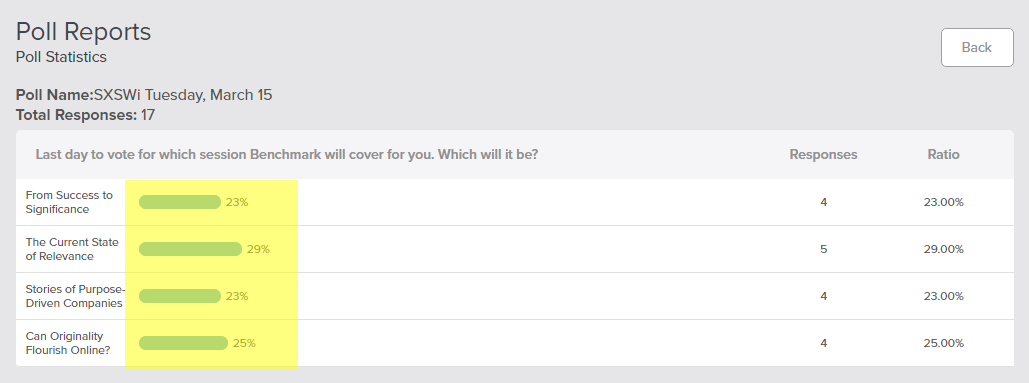
Stats for each poll can be seen by clicking on each item under the poll name. You can view the percentage of votes received by each option in your poll. Polls give you the unmatched convenience and efficiency of direct, free engagement with your subscribers.
5. Automation Reports
In 2016, we introduced this awesome tool to our customers. This practical tool for marketers has helped them to become a Precision-Oriented Marketer by keeping their email marketing on autopilot. The reports on automation journeys created by the users in Automation Pro can be seen under the Reports section of the dashboard. The email reports are similar to the one which is available for your general campaigns. It is useful to understand which automation journeys are working for the product and which needs your attention.
In Summary
At the end of the day, email marketing improvements are based on a few important metrics which every marketer must understand. By following certain tips like maintaining an opt-in list, writing compelling subject line, maintaining streamline sending frequency can help you improve every metrics explained above.
關於作:

Michael Benedict is Digital Marketing Manager for Benchmark Email. He is responsible for coordinating and implementing SEO & SMO strategies for Benchmark Offices' in different countries. Engineer by education, he began his career as a web designer in a start-up firm. In recent years he has helped clients build brand equity and solve their unique marketing challenges.
簡單卻強大的 EDM 行銷平台
立即免費註冊,體驗 EDM 行銷可以多麼輕鬆省力。
我們的公司
比較
解決方案
比較
帳戶
© Polaris Software,LLC Benchmark Email® 為
Polaris Software, LLC 的註冊商標
© Polaris Software,有限責任公司
Benchmark Email® 為 Polaris Software, LLC 的註冊商標