

A Beginner-Friendly Guide to Email Reporting (No Analytics Degree Required)

Let’s get something out of the way: most marketers don’t wake up excited to dive into analytics dashboards. You’re not alone if reporting feels like the part of email marketing you “get to later” (and later never quite arrives).
But here’s the truth: email reporting doesn’t have to be complicated, overwhelming, or math-heavy. You don’t need a data science degree. You don’t need a 30-tab spreadsheet. And you definitely don’t need to understand every metric under the sun.
What you do need is a simple way to interpret what’s working, what isn’t, and what to do next. That’s exactly what this guide will give you.
We recently released our updated Email Benchmarks Report. This report draws on data from our 68,000 users across 21 regions and over 90 industries. We used that report to help put this guide together, so if you’d like to see how your email marketing stacks up, make sure you download it.
Let’s break down the core metrics and what they actually mean in human terms, along with the easiest ways to improve them.
Start Here: The 4 Metrics That Matter Most
You may see dozens of numbers in your email reports, but not all of them deserve your time. Busy marketers should focus on these four:
- Open Rate
- Click-Through Rate (CTR)
- Bounce Rate
- Unsubscribes
That’s it. Master these, and you’ll understand 80% of your email performance.
1. Open Rate: Are people interested in what you’re sending?
Your open rate tells you how many subscribers opened your email. This is your first indicator of whether your messaging is resonating.
What affects open rate?
- Your subject line
- Your preview text
- Your sender name
- Your send time
- How often you email your list
- Your list health (active vs. inactive subscribers)
Healthy range: Varies by industry, but based on our report, most consistent senders see somewhere between 20–35%.
How to improve open rate
- Keep subject lines short and clear
- Use natural language (like a helpful coworker, not a billboard)
- Avoid over-sending
- Regularly clean your list
- Test small variations (“Tip for your Tuesday” vs. “A quick win for your Tuesday”)
Quick win: If you haven’t refreshed your preview text in a while, try updating it. It works harder than most marketers give it credit for.
2. Click-Through Rate (CTR): Are people taking action?
The click-through rate shows how many people clicked a link in your email. CTR is arguably the most important metric because it tells you whether your content is actually driving engagement.
What affects CTR?
- How clear is your CTA is
- How easy it is to skim your content
- Whether your content matches your audience’s needs
- Email length (shorter often works better)
- Clarity of your layout and spacing
Healthy range:
Often 2–5%, but even small increases signal meaningful improvement.
How to improve CTR
- Use one primary CTA
- Keep email copy short and benefit-driven
- Make buttons bold and obvious
- Use bullets and short paragraphs
- Remove distractions or unnecessary content blocks
Quick win: Move your CTA above the fold and include it again at the bottom. Two placements, one clear action.
3. Bounce Rate: Are your emails reaching inboxes?
A bounce happens when an email cannot be delivered. There are two types:
Hard bounce:
A permanent issue, meaning an invalid address, closed domain, or bad formatting. These should be removed from your list immediately.
Soft bounce:
A temporary issue, meaning a full mailbox, server issue, or message size too large. A few soft bounces are normal, but repeated soft bounces should be addressed.
Healthy range:
Under 1–2% is ideal.
How to improve bounce rate
- Clean your list regularly
- Verify your forms are collecting valid emails
- Remove known invalid contacts
- Authenticate your sending domain
This is where the new Benchmark Email shines: list hygiene tools, tagging, and segmentation make it easier to identify problem areas early before they impact seasonal sending.
4. Unsubscribes: Are you sending the right content at the right frequency?
Sometimes people unsubscribe. It’s normal. It doesn’t mean you did something wrong. But if the number spikes, it’s telling you something valuable.
Healthy range:
Usually 0.1–0.3% per send.

Why unsubscribes happen
- Too many emails
- Irrelevant content
- Misaligned expectations (they signed up for tips but got all promos)
- Seasonal fatigue
How to improve unsubscribe rate
- Send consistently but not excessively
- Match content to audience preferences
- Segment more (emailing everyone every time rarely works)
- Set expectations early, especially in your welcome email
Quick win: If your unsubscribe rate climbs, your content may need to be shorter, simpler, or more focused.
Understanding the Big Picture: What These Numbers Tell You
Here’s the truth most marketers miss: Metrics don’t exist to judge your performance. They exist to guide your next move.
Think of them like dashboard lights in your car, not reports on your driving skills.
- Open rate down? Try new subject line styles or check for list fatigue.
- Clicks low? Your message might not be clear enough or might be too long.
- Bounces rising? Time for a cleanup or a domain check.
- Unsubscribes up? Consider adjusting your frequency or segmenting better.
Each number is a clue pointing you toward an easy improvement.
A Simple Reporting Routine (That Takes 5 Minutes a Week)
You don’t need hour-long deep dives. Here’s a quick rhythm that keeps your email program healthy.
Weekly (5 minutes)
Check:
- Open rate
- CTR
- Unsubscribes
- Any deliverability warnings
Ask: “Would I open this email? Would I click it?”
Monthly (15 minutes)
Look for:
- Trends in best-performing subject lines
- The formats that get the most clicks
- Any segments showing better results than others
Ask: “What’s working that I can repeat? What’s not working that I can remove?”
Seasonally (20 minutes)
Review:
- List growth
- Bounce patterns
- Engagement by segment
- Content types that excel in busy or slow seasons
Ask: “How do I prep for the next high-volume period?”
That’s it. No spreadsheets needed unless you want them. (Most busy marketers do not.)
How the New Benchmark Email Makes Reporting Feel Easier
You’ll notice that none of the tips above require advanced analytics skills. That’s intentional. The new Benchmark Email platform is designed to help marketers interpret their results quickly, confidently, and without an IT translation guide.
How our platform supports simpler reporting:
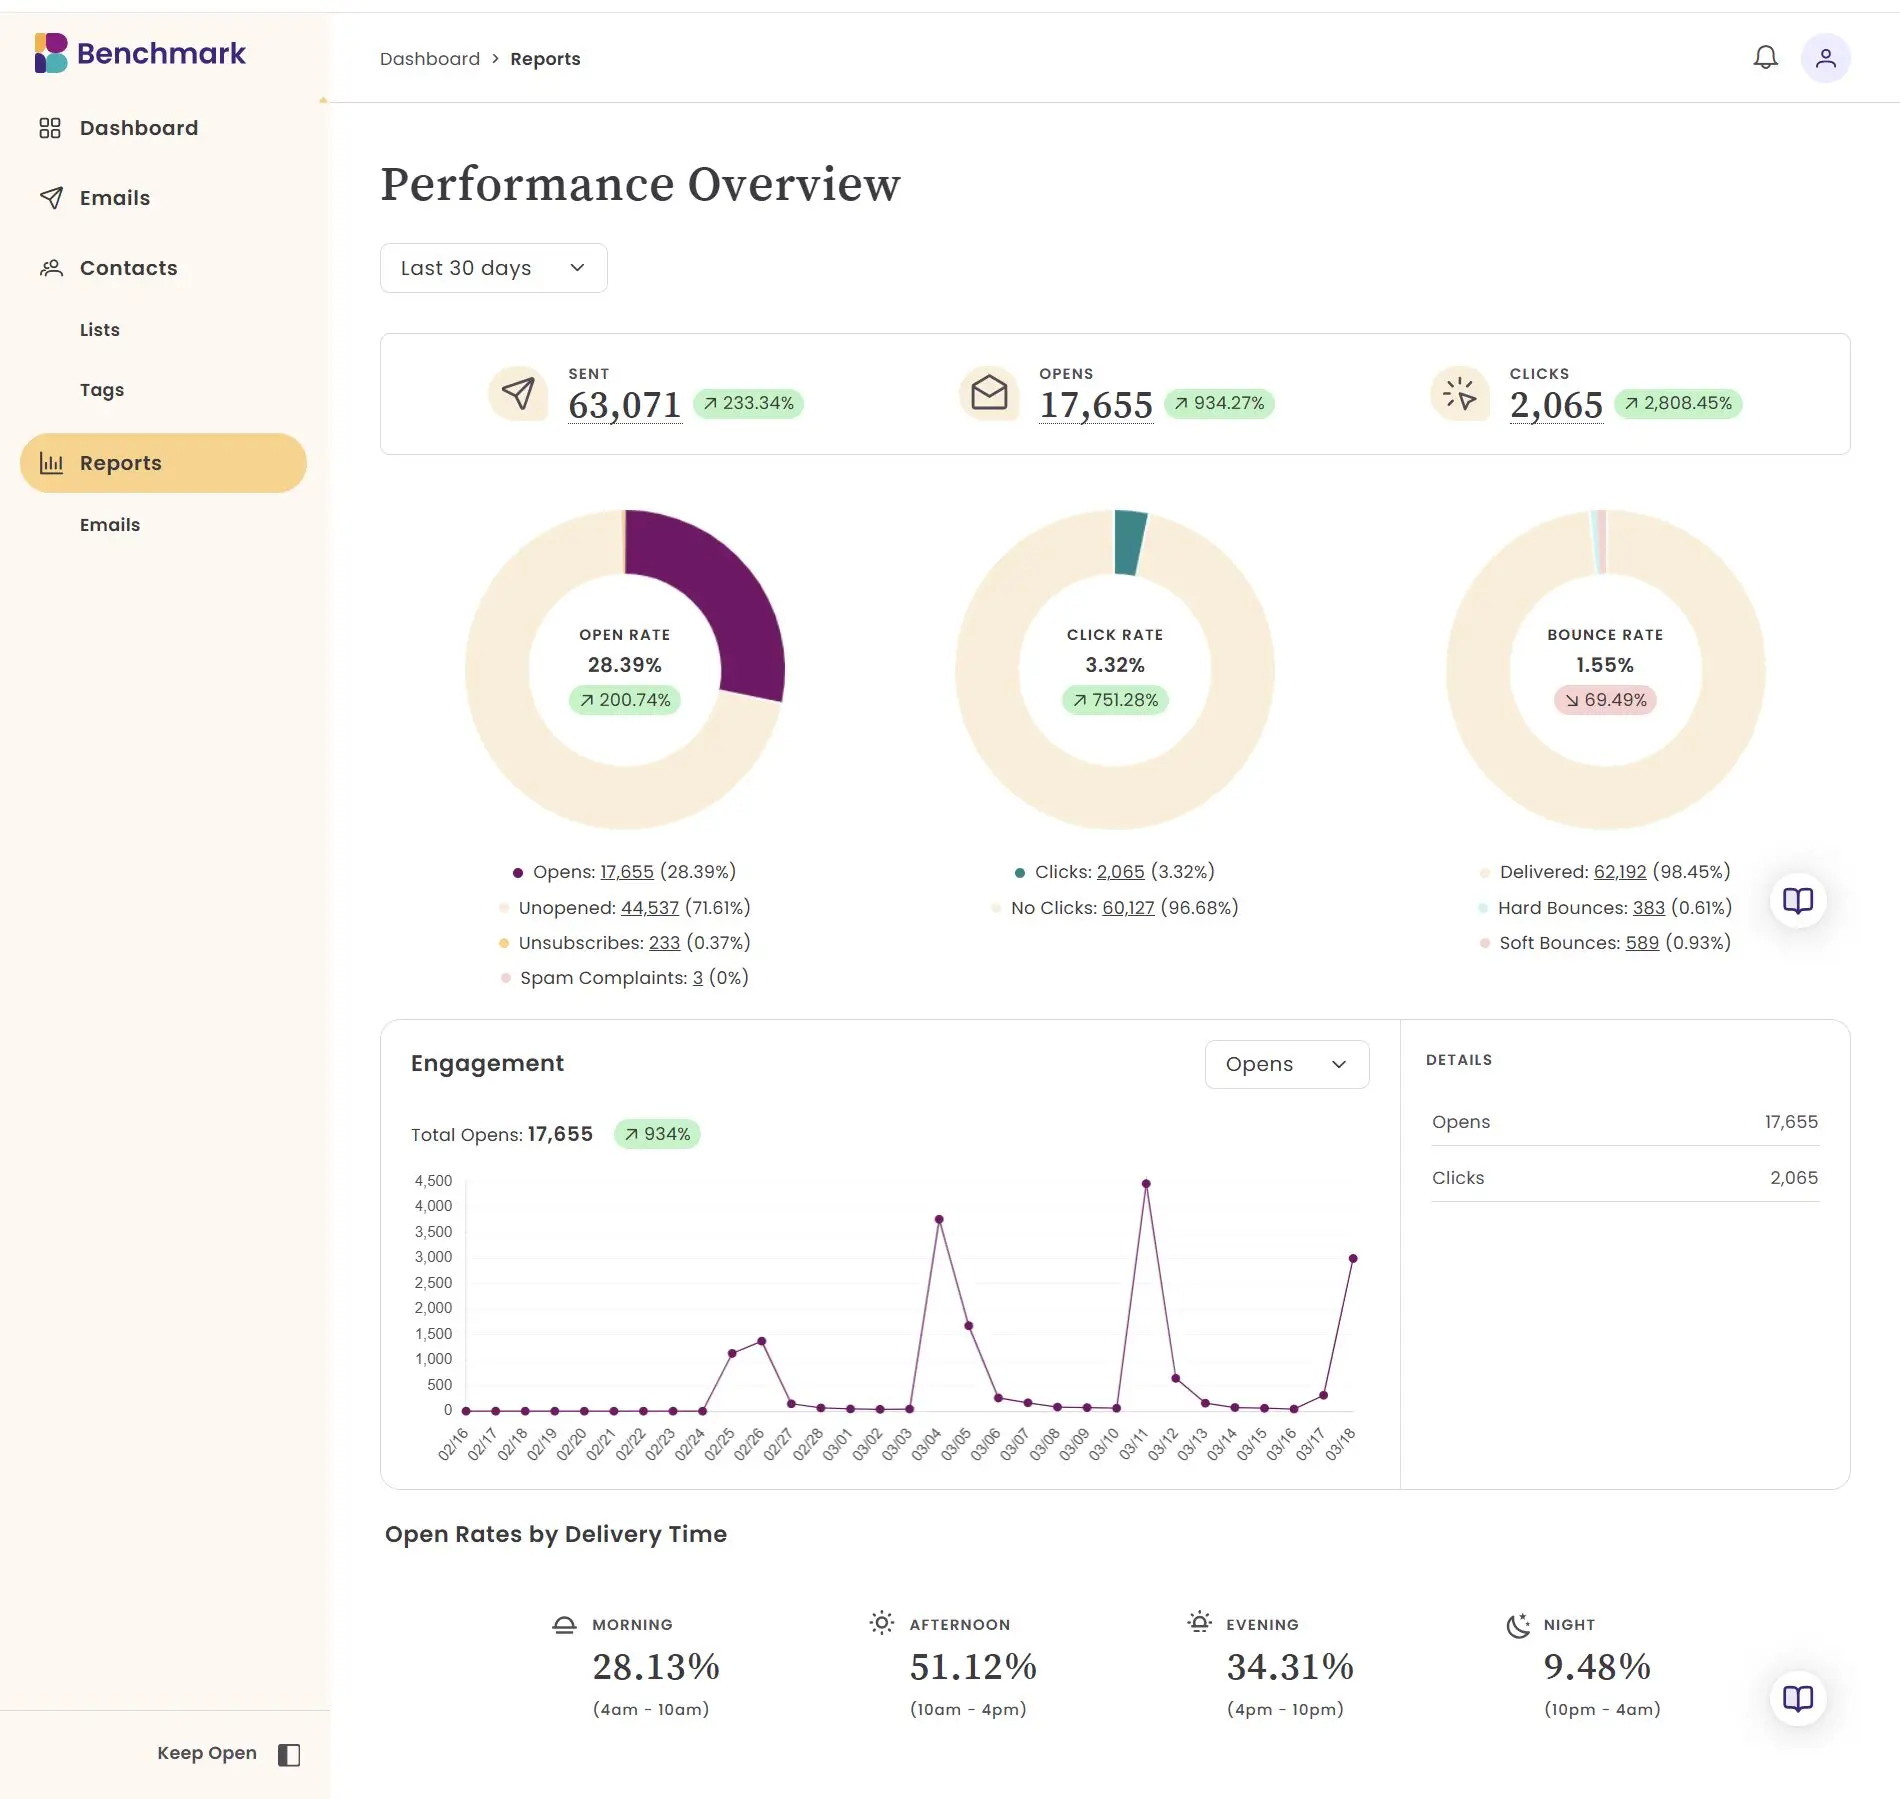
- Clear, visual metrics that make sense at a glance
- Easy-to-read graphs
- Deliverability insights that help protect your sender reputation
- Contact activity details that show how individuals engage
- Segmentation based on engagement, clicks, or activity
The goal isn’t to overwhelm you with data. It’s to help you make better decisions faster.
The Bottom Line
Email reporting should make your life easier, not harder. When you focus on the metrics that matter and understand what they’re telling you, you can:
- Create smarter content
- Improve deliverability
- Strengthen segmentation
- Build trust with your audience
- Make each send more effective than the last
You don’t need to track everything. You just need the right things. And once reporting feels simple, email marketing starts to feel a whole lot lighter, more intuitive, and, dare we say it, actually fun.
About the Author:

Content Marketing Manager | Content marketing, inbound funnel, social media, email nurture | Natalie Slyman is an experienced Content Marketing Manager at Benchmark Email with a strong B2B background and a knack for crafting pillar content that boosts SEO and brand authority. She regularly shares actionable insights—from remote-work strategies to AI-powered content workflows—via blog posts and webinars tailored for busy marketers.