Email Marketing Benchmarks By Industry and Region
When tracking email marketing ROI, there are a ton of factors to consider. Email marketing practices, and results, vary based on a number of factors. Everything from the time and day of the week to your email subject line can determine whether the email campaigns you send is opened and will drive the desired action.
But have you ever wondered how your email marketing results stack up compared to others within your space?
We have...which is why we decided to pull email benchmark data, including metrics like average email open rates and average clicks, from Benchmark Email users to gather a more detailed view of email marketing results by industry (from ecommerce, to nonprofits, to real estate even.)
This report pulled information from
The one-size-fits-all approach seldom works when implementing a strategy to capture, nurture, engage, and convert prospects. And while every email marketing strategy is different, the data presented can help shed light on where you need to be, and how you can go about getting there.
As of January 2023, this is where Benchmark Email users stack up:
| Industry | Average Open Rate | Average Click Rate | Average Bounce Rate | Average Unsubscribe Rate | Average Abuse Rate |
|---|---|---|---|---|---|
| Advertising / Marketing / PR / Media / Design | 26.41% | 1.60% | 5.21% | 0.17% | 0.17% |
| Architecture / Construction | 16.86% | 0.81% | 4.39% | 0.19% | 0.19% |
| Attractions / Entertainment / Hospitality | 27.59% | 1.30% | 5.44% | 0.16% | 0.16% |
| Colleges / Universities / Continue ED | 12.77% | 0.54% | 8.34% | 0.12% | 0.12% |
| Consultants / HR / Recruiting | 20.33% | 0.94% | 4.52% | 0.16% | 0.16% |
| Financial Services | 17.94% | 0.75% | 3.56% | 0.13% | 0.09% |
| Healthcare | 28.14% | 1.80% | 3.87% | 0.16% | 0.13% |
| Insurance | 17.92% | 0.71% | 3.57% | 0.09% | 0.15% |
| Manufacturing / Logistics / Engineering | 17.03% | 1.06% | 4.99% | 0.13% | 0.18% |
| Nonprofit / Associations / Public Service | 32.65% | 2.59% | 3.02% | 0.15% | 0.16% |
| Real Estate | 26.65% | 2.40% | 4.56% | 0.18% | 0.16% |
| Retail / Consumer Services | 24.28% | 1.34% | 4.16% | 0.16% | 0.18% |
| Schools (K-12) | 16.73% | 1.02% | 7.97% | 0.16% | 0.20% |
| Technology / Telecom | 20.33% | 1.19% | 5.56% | 0.18% | 0.14% |
| Wellness / Fitness | 24.46% | 1.27% | 4.81% | 0.20% | 0.01% |
| Non-Labeled Accounts | 21.44% | 2.16% | 7.12% | 0.14% | 0.00% |
| Employee size | Average Open Rate | Average Click Rate | Average Bounce Rate | Average Unsubscribe Rate | Average Abuse Rate |
|---|---|---|---|---|---|
| 0 - 25 | 21.11% | 2.43% | 4.65% | 0.22% | 0.09% |
| 25 - 100 | 21.50% | 2.60% | 5.57% | 0.17% | 0.10% |
| 100 - 250 | 22.24% | 1.94% | 5.74% | 0.17% | 0.08% |
| 250 - 1000 | 23.70% | 3.56% | 3.63% | 0.20% | 0.05% |
| 1K - 10K | 28.45% | 4.83% | 4.20% | 0.12% | 0.06% |
| 10K - 50K | 19.67% | 2.11% | 4.57% | 0.16% | 0.07% |
| 50K - 100K | 25.40% | 2.63% | 1.05% | 0.13% | 0.04% |
| Over 100K | 24.10% | 2.33% | 5.21% | 0.17% | 0.14% |
| #N/A | 21.57% | 2.39% | 4.63% | 0.20% | 0.11% |
| No data | 22.36% | 2.61% | 4.03% | 0.19% | 0.09% |
| Region | Average Open Rate | Average Click Rate | Average Bounce Rate | Average Unsubscribe Rate | Average Abuse Rate |
|---|---|---|---|---|---|
| Africa | 14.86% | 0.54% | 3.22% | 0.13% | 0.10% |
| Brazil | 14.56% | 0.57% | 2.62% | 0.10% | 0.17% |
| Central America | 20.53% | 0.61% | 5.28% | 0.07% | 0.04% |
| China | 28.68% | 0.68% | 6.51% | 0.14% | 0.08% |
| Europe | 16.56% | 0.62% | 2.55% | 0.24% | 0.84% |
| France | 11.02% | 0.73% | 5.05% | 0.33% | 0.11% |
| Germany | 23.64% | 1.38% | 4.55% | 0.29% | 0.06% |
| India | 9.05% | 0.84% | 13.31% | 0.13% | 0.07% |
| Italy | 21.00% | 1.32% | 1.86% | 0.19% | 0.10% |
| Japan | 31.75% | 1.30% | 0.90% | 0.15% | 0.01% |
| Mexico | 14.57% | 0.46% | 1.93% | 0.10% | 0.05% |
| Middle East | 25.15% | 0.89% | 2.36% | 0.19% | 0.09% |
| Oceania | 21.96% | 1.54% | 2.46% | 0.30% | 0.16% |
| Portugal | 27.69% | 0.91% | 1.42% | 0.11% | 0.16% |
| Russia | 14.57% | 1.61% | 2.04% | 0.17% | 0.88% |
| South America | 14.43% | 0.58% | 1.52% | 0.09% | 0.04% |
| South East Asia | 14.43% | 0.39% | 1.11% | 0.18% | 0.03% |
| Spain | 16.49% | 1.03% | 0.83% | 0.15% | 0.07% |
| Taiwan | 25.97% | 0.65% | 2.34% | 0.11% | 0.06% |
| UK | 10.59% | 1.63% | 9.15% | 0.24% | 0.11% |
| US / Canada | 29.48% | 1.18% | 7.19% | 0.19% | 0.14% |
Email Marketing Benchmarks You Should Be Measuring
Each email marketing metric tells us something different about our emails and how successful they were at driving a specific action. Below is a breakdown of each metric, the average rate for Benchmark Email users, and tips for improving these metrics in your practices.
Open Rate
What it is:
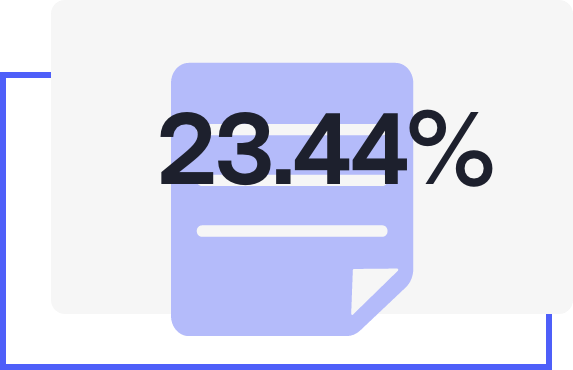
This indicates how often the emails you send are opened. And because an action cannot be taken from your emails unless they are opened, this is perhaps the most important email marketing metric.
Average open rate for Benchmark Email users:
users:

Tips for improving open rate:
Open rates depend heavily on whether you’ve built up enough trust and brand awareness with your subscribers and your email subject lines. Trust is built when your audience feels like you’re consistently delivering value. Therefore, it's crucial that you offer them something you know they need when you email your list. And as for email subject line tips, keep them clever, short, and sweet. And make sure they give an accurate representation of what’s in the email message.
Click Rate
What it is:
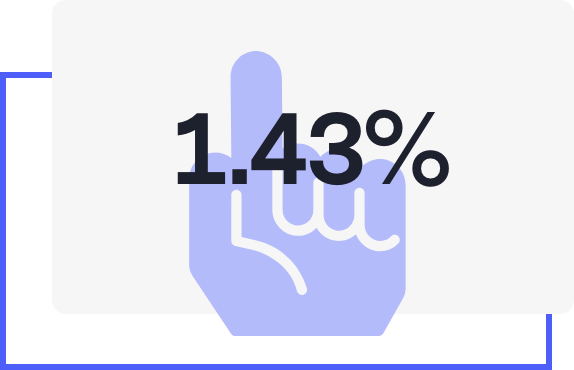
Click rate shows you how many of your sent emails generated a click. This metric is extremely important because the main reason you’re sending emails is so that you motivate an action. You want your recipients to download your whitepaper, set up a demo, fill out your survey, or do whatever your call-to-action is.
Average click rate for Benchmark Email users:
users:

Tips for improving click rate:
Make sure you’re segmenting your lists based on key indicators, like industry, where your prospects are in the customer journey, and site behavior. These indicators will tell you more about your prospects so you can send them offers that make sense for them. Also, make your copy dazzle. Use copywriting techniques to improve your conversions and see your click rate soar.
Bounce Rate
What it is:
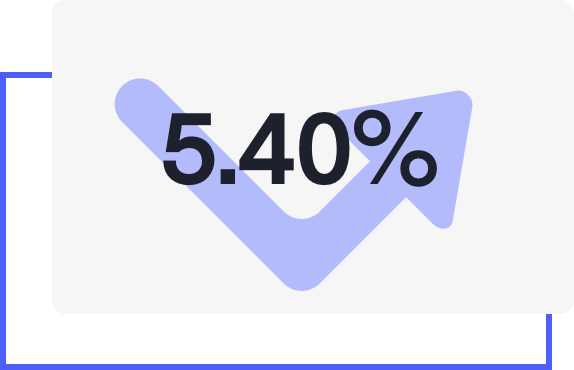
This is the number of emails in your subscriber list that didn’t receive your email because their server denied it.
Average bounce rate for Benchmark Email users:
users:

Bounce rate:
You must implement regular list pruning so you can weed out any stale email addresses. This will not only improve your deliverability, but it will save you wasted time trying to nurture prospects who won’t receive your emails anyway.
Unsubscribe Rate
What it is:
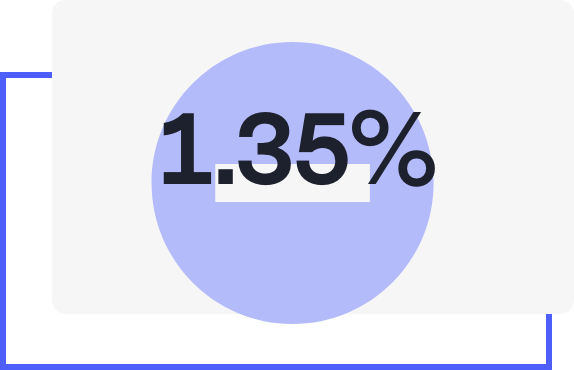
This is the rate at which people on your list choose to opt-out of receiving your emails. There will always be people who unsubscribe, but they’re hard to win back, so you want this number to be low.
Average rate for Benchmark Email
users:

Tips for improving unsubscribe rate:
To lower your unsubscribe rate, make sure you’re not inundating your prospects with messaging. The more messages they receive, the more likely it is they’ll get annoyed and unsubscribe. Also, make sure you’re always providing value. Don’t email just to email. Make it worth their while.
A few small changes can improve your email marketing metrics for optimal performance. The email marketing benchmarks for industry and region above should give you an idea of what goals you should be aiming for. From there, you can break down each metric and determine if you’re doing what you can to improve those numbers. And if you need any help, make sure you head to our blog for weekly tips and updates, as well as our resource page for more in-depth guides and tutorials.
 nearly
  in
in  across


