

Customer Profile Analysis: Methods and Hacks to Boost Your Sales Process

An ideal customer profile (ICP) is essentially a hypothetical narrative of the type of companies that would get the most value from your product(s). These companies tend to have the fastest sales cycle, the greatest customer retention rates, and the highest number of evangelists for your business.
Such a hypothetical description of a perfect-fit customer can inform your entire marketing and sales process, helping you allocate your resources to those prospects who will benefit the most from your offerings and, in turn, provide the most value to your company.
Read this article to find out how customer profile analysis can help your sales process.
Sources of Customer Data for Your Customer Profile Analysis
Understanding your customers is critical to succeeding with your sales targets. How will you better cater your services and products to them without properly knowing their individual profiles?
To create an ICP that fits your business, having the right data is key. The question is, where can you gather this important information? Here are five great sources to capture customer data for your customer profile analysis.
1. Existing Customers
While not every customer is an ideal one, your existing customer base is the best place to source data.
So, survey your existing customers to discover which of them:
- Drive the most value for your business
- Get the most value from your business
- Are happiest with your product(s)
These are your top customers. And to do this, you need to consider:
- Customer lifetime value (CLV)
- Their ROI with your product(s)
Customer satisfaction metrics, including Net Promoter Score (NPS), Customer Satisfaction (CSAT), or Customer Effort Score (CES)

When you know all these numbers for your existing customers, you can pinpoint your top customers. Along with this data, from your CRM, export key customer data points like company size, budget, challenges, etc., to a Google spreadsheet for later analysis.
Schedule interviews and create surveys to get insights from customers about why they chose your product, who were the key stakeholders in the purchase process, what competitors they were considering, and what convinced them to go with you.
Oh, and in your customer surveys, use multiple-choice questions to get consistent responses from your customers and simplify their effort. This also makes it easier to analyze this data in your spreadsheet later on. Using a survey builder would do the trick, or an email marketing software that allows you to send surveys, like Benchmark Email.
2. Potential Customers
If your company is relatively new and doesn’t yet have a sufficient customer base, then you’ll need to find potential customers to interview and survey. These are your ideal target customers or possibly not-so-happy customers of your top competitors.
To find these, go social — dig into Facebook groups, Slack channels, subreddits, LinkedIn groups, Twitter topics, etc. Creating a persona to understand your potential customers is also important.
And once you find your potential customers, it’s the same deal — conduct interviews and share surveys. The difference is that with potential customers, you may need to offer an incentive, such as a free extended subscription of your product upon launch or an Amazon gift card in exchange for their help.
3. Analysis Tools
Qualitative interview questions and surveys are a must, but you can’t gain a complete picture without knowing what people are doing on your website and inside your product.
Use tools like Google Analytics to see how prospects engage with your website and content. On which page do they usually arrive first? How do they land on the pricing page? Which landing pages do they visit and stay on the most? From which pages do they typically exit?
Plus, if you’re using Google Ads, you can get in-depth demographic visitor info like age, gender, location, etc. Also, evaluate how customers use your product — which features are used more, which features are going unused, how they interact with menu items, and so on.
And be sure to segment website visitors and users who actually pay for your product. Otherwise, you could be looking at and optimizing for the non-paying majority. For instance, Google Analytics might tell you that over 70% of your visitors come from Asia, but if only 10% of your paying customers are in Asia, then it doesn’t make sense to optimize for that segment.
4. Sales Calls
Your sales team can have unique insights about your ideal customer considering all the countless conversations they’re having with prospects each day.
By asking the right discovery questions during sales calls, your reps can better learn the company they’re selling to, their processes, the people involved in decision-making, and the key challenges that need solving.
5. Competitor Analysis
Never underestimate the value of analyzing your competitors. From their website structure and messaging to who they are targeting on social media, there’s a potential goldmine of useful customer profile data you can dig out with competitor analysis. Check out this great list of competitor analysis tools to analyze various aspects of your competition’s strategy, from their ads strategy to content and email marketing.
And if you’re in eCommerce and using a platform like Shopify, then competitor price tracking is also crucial.
Combine all these sources of customer data, and you should now have enough data to start shaping your ideal customer profile into a Google spreadsheet.
Data Interpretation Strategies
Got all the relevant data you need? Great — now comes the hard part!
With a sizable spreadsheet laid out on your screen, can you make any real sense of your customer data?
Here are three tricks to better understand and analyze your customer profile data in Google Sheets.
1. Create Charts In Google Sheets
Visuals tend to be favored over plain text, which means data visualization and analysis are done best with colorful charts.
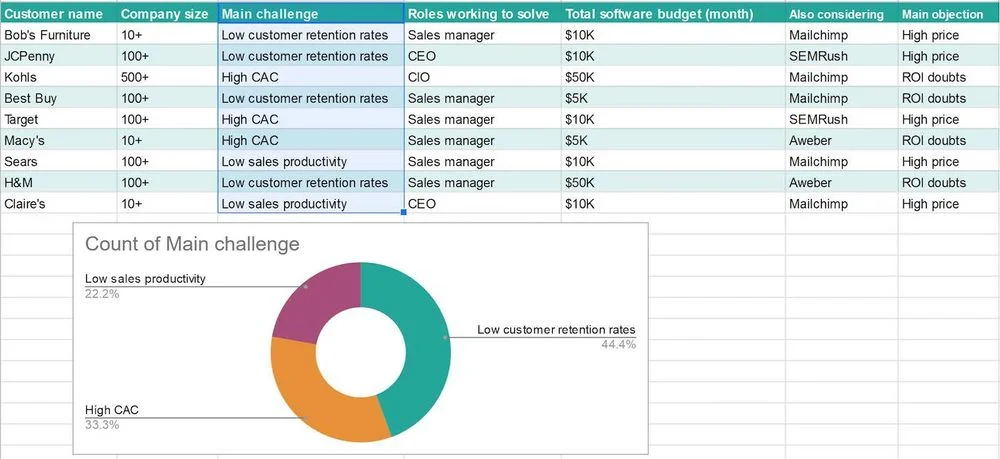
Let’s say you’ve gathered data on the primary pain point your prospects are hoping to solve with your product — so, which problem is the most prevalent?
In your sheet, highlight the row you want to analyze. Then from the Spreadsheets toolbar, click Insert > Chart.
Google Sheets creates a quick chart that you can easily customize to see the data points you highlighted, enabling a visual view of the most prevalent customer pain point.
2. Use the ‘Explore’ Tool
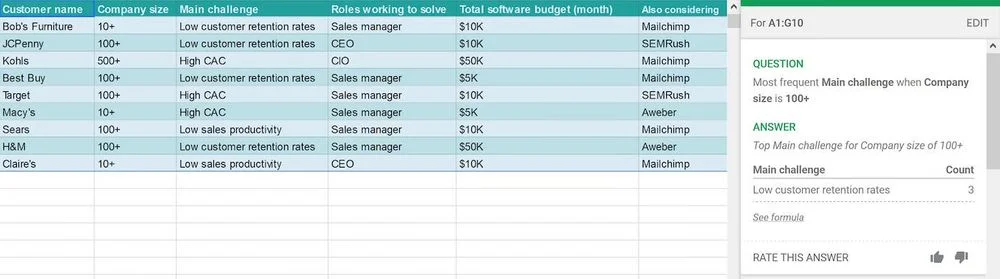
Google allows a way to analyze business data in Sheets using machine learning. Rather than using elaborate formulas to crunch your numbers, you can use the ‘Explore’ tool to ask questions and quickly gain insights.
Begin by highlighting the rows and columns you want to analyze. Then, ask your question.
For instance, you could ask “Most frequent competitor considered,” and Google Sheets will give you an answer based on the data in your sheet.
You can also dive deeper and compare multiple data points. For example, you could ask “Most frequent competitors considered when company size is 100+.” Easy as pie.
3. Create Pivot Tables
A pivot table is a nifty way to summarize data and derive meaningful patterns between various data points. For example, you can create a pivot table to see the total of each region’s sales. Then, get a breakdown of your salespeople’s individual sales for specific regions.
Start by selecting the columns with the data that you wish to analyze. Ensure your data is in columns with headers, then select Insert > Pivot table. This way, you can create a new sheet where you’ll need to add values into your rows and columns based on the data you want to see.
Once you have the data in, you can change how it’s sorted or filter it to drill down to specifics. You can also have custom calculations and data groups to better analyze the data in your table.
Strategies for Your Sales Team to Integrate Customer Profile Analysis
Data? Check. Analysis? Check.
Time to leverage what you learned to level up your sales process. Here are eight great ways to do just that.
1. Build Sales-Specific ICPs
An ICP is useful for all teams, specifically sales.
To have your sales team makes the most of ICPs, make sure:
- To capture the right customer data and show reps what to do with prospects that fit a specific profile. Include info such as a short elevator pitch meant for each profile, along with data on the typical purchase process for this type of customer. This helps reps to adapt their pitch to fit the needs of this customer.
- All customer profiles are handy to all reps, say in a shared Google Drive folder or a project management tool, as opposed to being buried in a Slack channel’s chasm or a long email thread. This helps reps to easily refer to the profiles as they craft pitches, proposals, emails, sales decks, etc.
2. Segment Leads by Profiles
Help your sales reps get a head start when touching base with new leads by segmenting those leads.
Typically, marketing qualified leads (MQLs) have already been through some segmentation based on how they entered the sales pipeline — such as by filling out a website form, getting on a call, LinkedIn InMail, etc.
But when you further segment your leads by profiles, your sales team will have a clearer view of who they’re talking to, what are the primary goals and concerns of these leads, and how best to convince them to do business with you. So, in your CRM, segment leads based on ICP data points like size of the company, industry vertical, initial mode of contact, and so on.
3. Build Targeted Emails for Different Profiles
Using email templates is an excellent way to improve your sales team’s efficiency. But why not kick it up a notch by creating templates tailored to each ICP?
After all, how your salespeople sell to each customer profile is different — with different feature priorities, budget, etc. By creating targeted email templates for different profiles, your sales team is laser-focused on the people they’re selling to.
Your CRM data can also help improve your email marketing efforts as it could help better connect the dots between your marketing messaging and customer pain points. Benchmark Email integrates well with various customer management apps.
4. Create Personalized Pipelines for Each Profile
Just like creating targeted email templates, you can also benefit from personalized sales pipelines for different ICPs to match the path your customers take to convert.
Your sales reps are dealing with very different buyer journeys, especially if your business serves both SMBs and enterprises.
For instance, an SMB may have a shorter sales cycle with fewer internal approvals, meetings, and demos. Whereas for larger enterprise profiles, it may take a myriad of meetings with several stakeholders, approvals from different departments, and elaborate demos.
Your customer profile analysis lets your team adapt their sales process to the steps that customers tend to take to convert, and if you have personalized pipelines ready, your reps get a clearer picture of what’s needed to close deals.
5. Regularly Update and Reassess the Profiles
For your customer profile analysis to remain truly effective, you must keep it up-to-date. That’s how your sales team will always be in accord with the needs and motivations of your customers.
Here’s a sample schedule you can follow to keep your analysis on point:
- Every Three Months: Evaluate the results of any new strategies you implement. Are your revised email templates earning better click-through rates? Has the conversion rate improved in any sales pipeline?
- Every Six Months: Interview customers who are seeing success thanks to your business, and add their data or feedback to your CRM. Remove data of customers who don’t or no longer fit the criteria of a successful customer.
- Every Twelve Months: Take the time to talk with your top customers to learn exactly how they’re using your product, their current ROI, and how you can serve them even better. Reanalyze your data with new charts and pivot tables to derive important insights. Also, update your ICPs, templates, and pipelines if you see substantial changes in the data.
6. Generate and Apply Data Insights from Analytics
Specifically, your website analytics. From reading through a blog post to clicking on a CTA, every on-site action a prospect takes can offer valuable insight into customer behavior.
With tools like Google Analytics, you have easy access to key metrics such as time on page, bounce rate, goals completion, and so on. And with tools like Hotjar, you can further analyze user behavior with heatmaps and screen recordings. This can help you interpret what your audience finds more engaging and how you can create a more effective website experience and product positioning.
For example, if prospects are having trouble navigating certain sales pages, work on the interface to create more intuitive navigation. If there’s a page prospects spend more time on or engage with more, analyze that page’s content to see what’s keeping people interested.
7. Create Better Sales Forecasts and Plan Your Future
A sales forecast is an in-depth estimate that predicts what a salesperson or team will sell weekly, monthly, quarterly, or annually.
The more accurate your sales forecasts are, the better you can plan your growth activities.
Looking at past behavioral data can tell you which features customers have found most valuable over time and which features are worth either revising or letting go of. Similarly, reviewing your most popular website pages can also inform your content strategy, helping you focus on topics and formats that best serve your audience’s challenges and drive the most engagement.
Furthermore, staying updated with market trends helps you understand what other companies in your niche are doing well and where they’re lacking, so you can plan for new features that capitalize on those areas.
And with new trends like remote work, you should also use your data to better train your remote sales teams and prepare them for whatever challenges lie ahead. With a variety of tools to facilitate remote work and secure data sharing, it’s now easier than ever to provide access to data for remote sales teams.After all, the better you understand your market trends, the better product-market fit you’ll have.
8. Better Predict the Customer Journey
The best way to understand each of your customer profile’s buying behavior is to map their journey.
Customer journey mapping is a tactic that involves creating a detailed, visual representation of the customer journey based on important touchpoints between a customer and your company before, during, and after purchase.
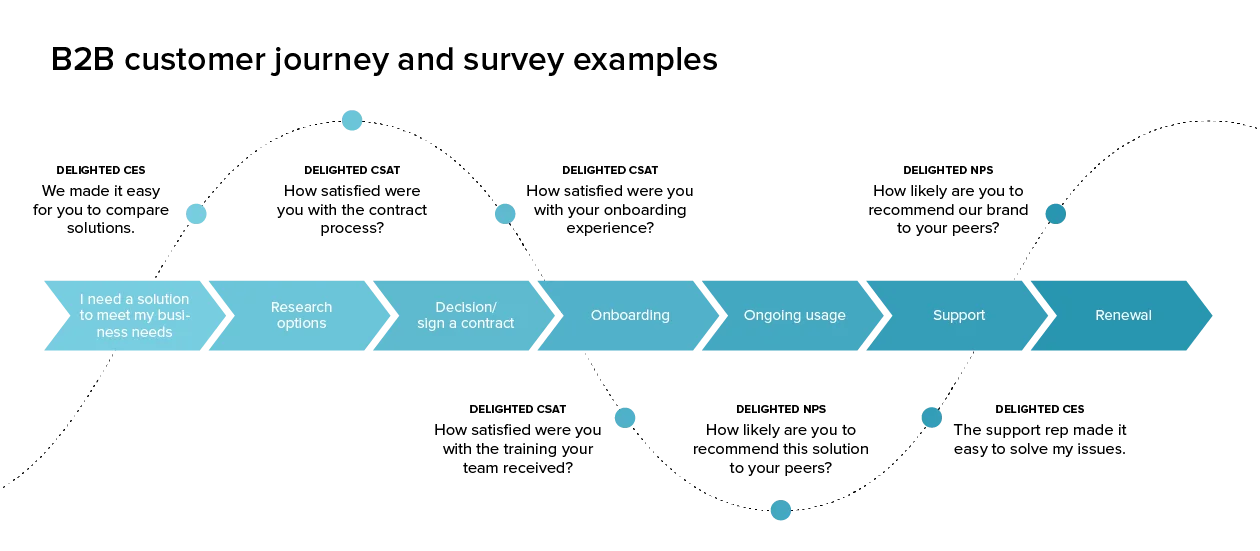
As you can see in the image above, you can use NPS, CSAT, and CES surveys to capture first-hand customer feedback to include within your customer journey map and analyze the journey-wide customer experience.
Consider Uber. Minor touchpoints include activities like following the brand on Twitter. Major touch points include activities like downloading the app, requesting a ride, or using the referral program. Once touchpoints are defined, marketers at Uber may analyze what factors affect each touchpoint.
Questions like what influenced a user to download the app, what led a user to register to become an Uber driver, what led to an uninstall, and so on can help pinpoint successful and failed touchpoints and build a plan to improve the customer journey.
You can also build email drip campaigns meant to re-engage customers based on certain milestones, such as weeks or months of inactivity.
Time to Sell Better
At the end of the day, all that customer data and analysis is only as good as its application. Use the strategies outlined above to help your sales team take full advantage of your customer profile analysis and keep your team focused not just on metrics but on the needs and motives of your customers.
When your sales process is people-first, more sales are bound to follow.
Author Bio
 Mark Quadros is a SaaS content marketer that helps brands create and distribute rad content. On a similar note, Mark loves content and contributes to several authoritative blogs like HubSpot, CoSchedule, Foundr, etc. Connect with him via LinkedIn or Twitter.

A powerfully simple email marketing platform
Sign up for free to see how effortless email marketing can be.
Our Company
Compare
Solutions
Compare
Account
© Polaris Software, LLC Benchmark Email® is a registered trademark of Polaris Software, LLC
© Polaris Software, LLC
Benchmark Email® is a registered trademark of Polaris Software, LLC