


Key Takeaways
- An email analytics dashboard consolidates your campaign data, such as opens, clicks, bounces, conversions, and more, into one centralized view, eliminating the need to pull scattered reports manually.
- The most valuable dashboard features include real-time performance tracking, visual reports and click maps, audience segmentation and filtering, integrations with your CRM or e-commerce platform, and customizable views tailored to your business goals.
- Not all dashboards are built the same. The right one depends on your business type. E-commerce brands benefit most from revenue attribution tools (like Klaviyo), while small businesses and busy marketers are better served by simpler, more intuitive interfaces (like Benchmark Email or Constant Contact).
- Segmentation-based insights are critical: filtering your data by audience type or campaign category can uncover performance differences that broad averages completely hide.
- A good dashboard doesn’t just show you what happened; it helps you act faster, prove ROI to leadership, and make smarter decisions about future campaigns before problems become costly.
You’re sending campaigns, watching the numbers roll in, and then… what? If your email data lives in scattered reports that take forever to pull together, you’re working harder than you have to.
An email analytics dashboard changes that equation. It puts your opens, clicks, conversions, and revenue in one place so you can see what’s working and fix what isn’t. This guide covers the best dashboards available, the features that actually matter, and how to pick the right one for your business.
What Is an Email Analytics Dashboard
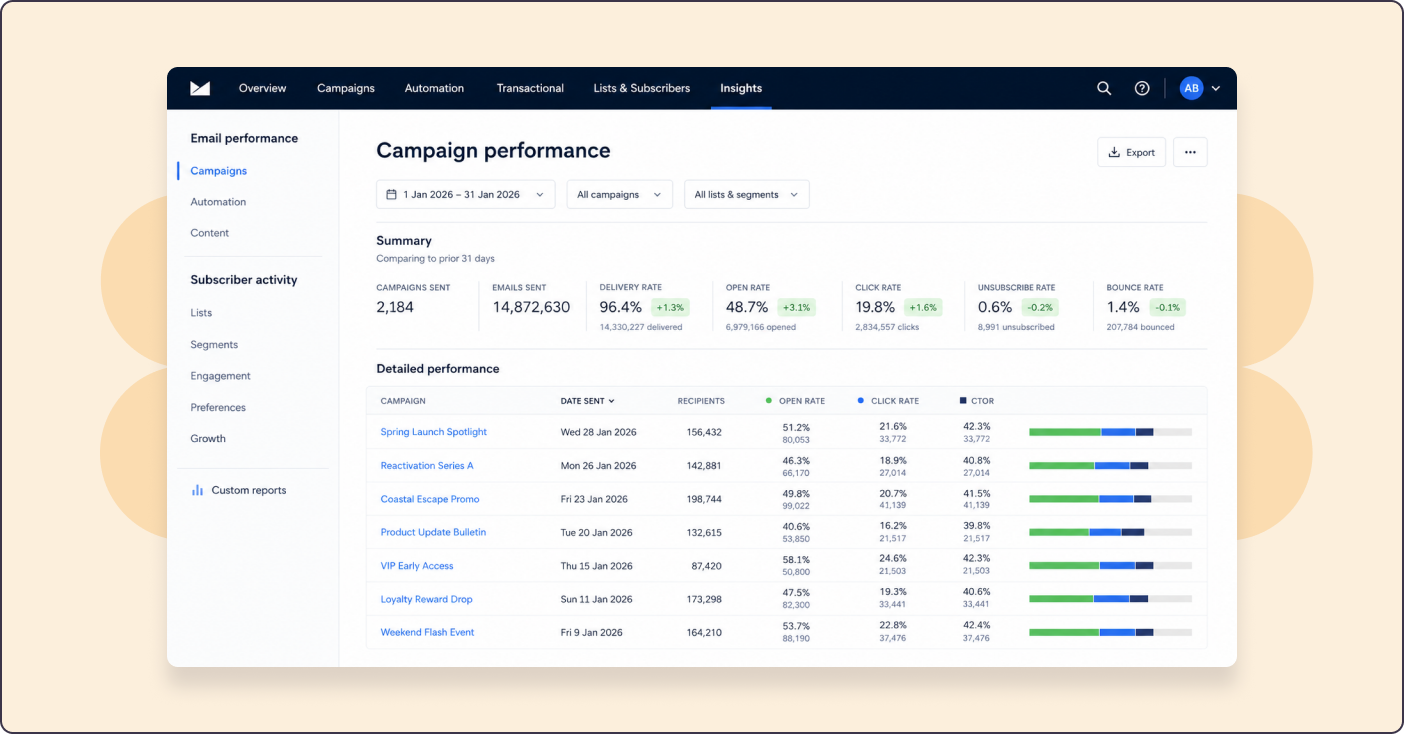
An email analytics dashboard is a centralized interface that consolidates your campaign data into a single visual location, displaying metrics such as opens, clicks, bounces, and conversions through charts and summary cards. Instead of digging through multiple reports or exporting spreadsheets, you get a single view of how your emails are actually performing.
Think of it as your email marketing command center. The best dashboards consolidate data automatically and update in real time, so you’re always looking at current performance rather than yesterday’s numbers.
Here’s what a typical dashboard displays:
- Open rates: The percentage of recipients who opened your email
- Click-through rates: How many people clicked links within your message
- Bounce rates: Emails that failed to reach the recipient’s inbox
- Unsubscribe rates: Subscribers who opted out after your campaign
- Conversion tracking: Actions taken after clicking, like purchases or form submissions
Why Email Marketers Need an Analytics Dashboard
If you’re putting time into creating campaigns, you deserve to know whether they’re working. A dashboard eliminates guesswork by showing exactly what resonates with your audience and what falls flat.
For marketers who only spend a fraction of their week on email, at-a-glance insights make a real difference. You can spot a sudden spike in unsubscribes or a drop in clicks before small issues become bigger problems.
Dashboards also help when leadership asks about ROI. Instead of scrambling to pull reports, you’ll have the data ready to show how email contributes to business goals, demonstrating email marketing’s $36 return per $1 spent.
Essential Features in an Email Reporting Dashboard
Before diving into specific tools, it helps to know what separates a useful dashboard from one that just looks pretty. The features below can mean the difference between data you glance at and insights you actually act on.
Real-Time Performance Tracking
When you’re running a flash sale or time-sensitive promotion, waiting 24 hours for data isn’t ideal. Real-time tracking lets you see how a campaign performs within minutes of hitting send.
This immediacy matters for quick adjustments. If your subject line isn’t landing with the first segment, you can tweak your approach before sending to the rest of your list.
Visual Reports and Data Displays
Raw numbers in a spreadsheet can overwhelm even experienced marketers. Charts, graphs, and heat maps transform that data into something you can interpret at a glance.
Click maps, for example, show exactly where people are clicking within your email. That visual feedback helps you optimize button placement and link positioning for future campaigns.
Audience Segmentation and Filtering
A good dashboard lets you slice data by subscriber segments, campaign types, or date ranges. This filtering reveals how different audiences respond to your messaging.
You might discover that your weekly newsletter performs better with long-time subscribers while promotional emails resonate more with recent signups. Without filtering, that insight remains hidden, yet segmented campaigns generate 760% higher revenue than broadcast campaigns.
Integration with Marketing Tools
Your email dashboard becomes more powerful when it connects with your CRM, e-commerce platform, or Google Analytics. Integrations give you a complete picture of the customer journey, from email click to website visit to purchase.
Customizable Dashboard Views
Different businesses care about different metrics. An e-commerce store prioritizes revenue per email, while a B2B company might focus on lead quality. The ability to customize which metrics appear front and center ensures you’re always looking at what matters most.
10 Best Email Analytics Dashboards
Now for the main event. Here are ten email analytics dashboards worth considering, starting with options built for marketers who want results without complexity.
Benchmark Email
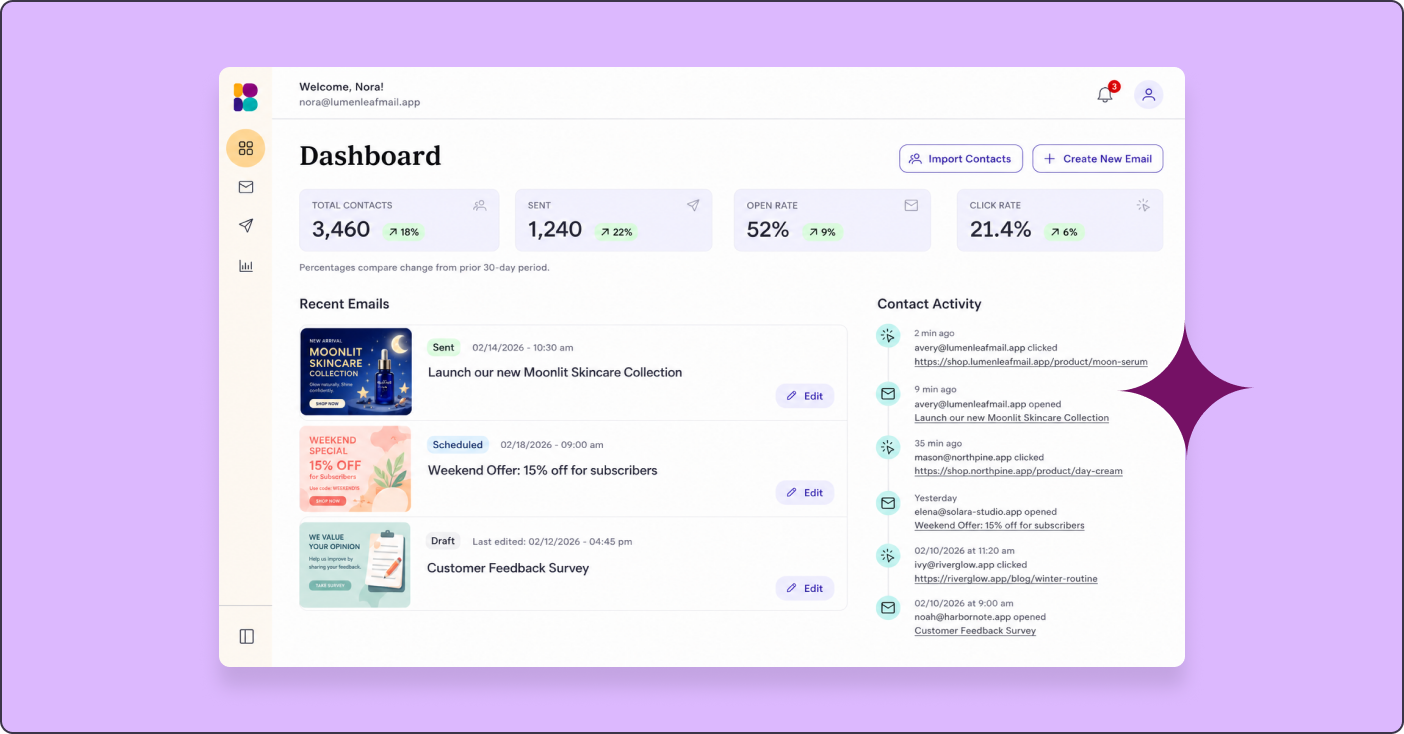
Benchmark Email’s reports dashboard is built for busy marketers who want clarity without a learning curve. The interface presents key metrics in clean, easy-to-understand visual reports, with real-time tracking that shows campaign performance as it happens.
For marketers juggling multiple responsibilities, this simplicity is a major advantage. You get the data you need without wading through features you’ll never use.
Mailchimp
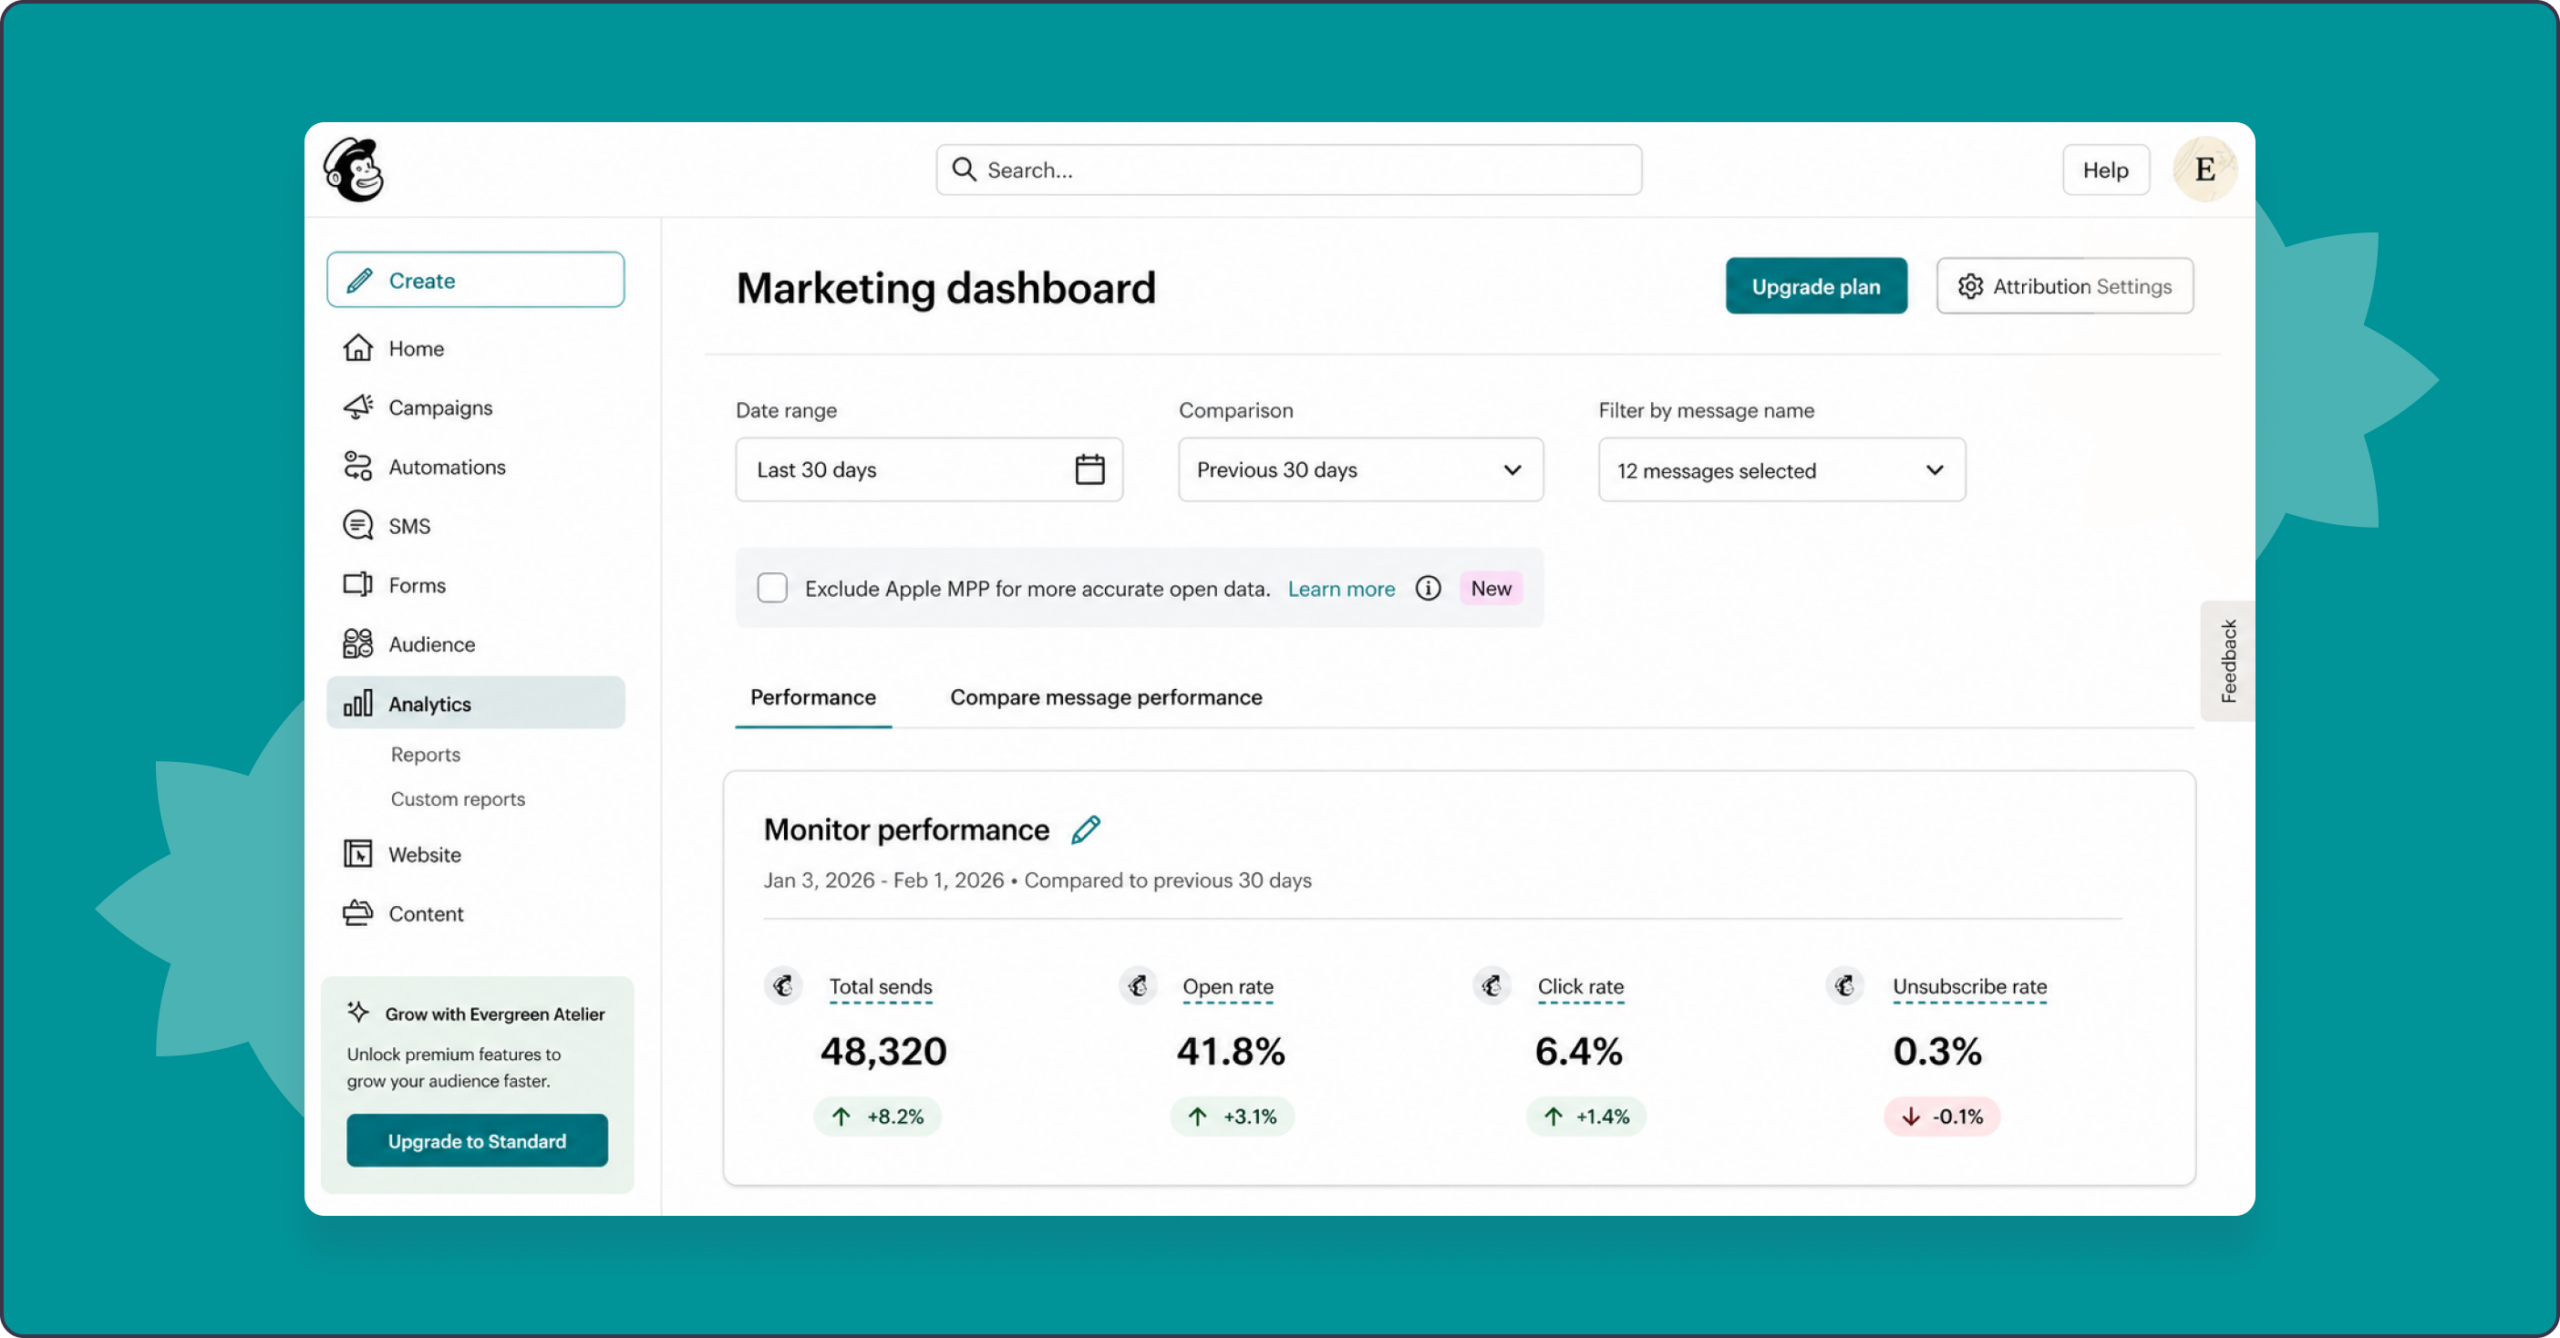
Mailchimp offers a robust analytics suite with detailed campaign breakdowns and Google Analytics integration. The platform excels at showing engagement trends over time and includes A/B test reporting with statistical significance indicators.
It’s well-suited for marketers who want granular data and don’t mind spending time exploring the interface.
Constant Contact

Constant Contact keeps reporting straightforward, making it a solid choice for small businesses and email beginners. The dashboard focuses on essential metrics with color-coded performance indicators that help you quickly assess campaign health.
MailerLite

MailerLite combines simplicity with affordability while covering core metrics. The platform highlights trends over time rather than just current numbers, and automation flow reporting shows where subscribers drop off in your sequences.
HubSpot
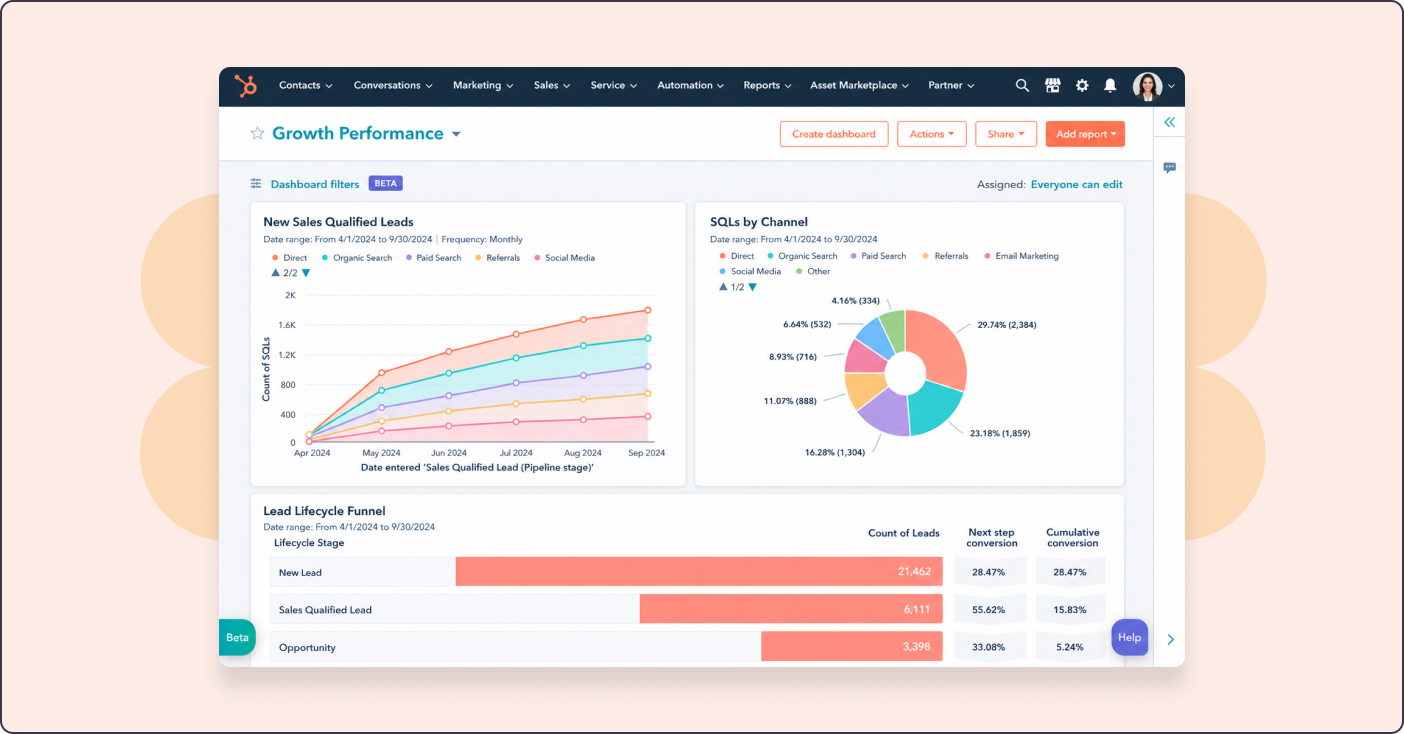
HubSpot’s email dashboard integrates deeply with its CRM, making it ideal for marketers working alongside sales teams. You can track how email campaigns influence deals and move leads through your funnel, plus see how long recipients spend reading your emails.
Klaviyo
Klaviyo shines for e-commerce businesses with predictive analytics and revenue attribution. The dashboard shows not just opens and clicks, but also the actual revenue generated by each campaign, with machine-learning features that predict when customers are likely to buy or churn.
ActiveCampaign

ActiveCampaign brings together email metrics, sales funnel tracking, and lead scoring. Custom reporting features let you build dashboards tailored to your specific business, and you can see how email engagement impacts lead quality.
Brevo

Brevo offers multi-channel reporting for email, SMS, and chat in a single dashboard. Deliverability monitoring and inbox placement tracking go beyond basic metrics to show whether your emails are actually reaching the primary inbox.
Campaign Monitor
Campaign Monitor provides visually appealing reports with strong engagement tracking. The heat map feature shows which parts of your email get the most clicks, and geographic data reveals where your emails are being opened.
GetResponse

GetResponse includes an all-in-one dashboard that tracks email, webinars, and landing pages. The time tracker shows when subscribers are most likely to open emails, helping you optimize send times.

Email Marketing KPIs Every Dashboard Should Track
Having a dashboard is one thing. Knowing which numbers actually matter is another. Here are six KPIs that give you a complete picture of campaign health, though the full spectrum of email metrics extends even further.
Open Rate
Open rate measures the percentage of recipients who opened your email. While privacy features like Apple Mail Privacy Protection have made this metric less reliable (MPP now accounts for over 50% of all email opens), it still offers a general sense of subject line effectiveness.
Focus on trends rather than absolute numbers. A sudden drop might signal deliverability issues or audience fatigue.
Click-Through Rate
Click-through rate (CTR) shows the percentage of recipients who clicked a link in your email. Unlike open rate, CTR isn’t affected by privacy protections, making it a more reliable indicator of engagement.
This metric reveals whether your content and calls to action are compelling enough to drive action.
Conversion Rate
Conversion rate tracks recipients who completed a desired action after clicking, whether that’s making a purchase, filling out a form, or downloading a resource. This metric directly links email engagement to business outcomes, especially when combined with UTM tracking for precise attribution.
Bounce Rate
Bounce rate measures emails that couldn’t be delivered. Hard bounces indicate invalid addresses, while soft bounces suggest temporary issues like full inboxes.
A high bounce rate hurts your sender reputation and can land future emails in spam folders. Regular list cleaning helps keep this number low.
Unsubscribe Rate
Unsubscribe rate shows how many recipients opted out after receiving your campaign. A rising rate often signals problems with content relevance, email frequency, or audience targeting.
Some unsubscribes are healthy, though. They keep your list filled with people who actually want to hear from you.
List Growth Rate
List growth rate tracks how your subscriber base changes over time, accounting for new signups, unsubscribes, and bounces. Positive growth indicates your acquisition efforts are outpacing attrition.
How to Choose the Right Email Analytics Dashboard
With so many options available, picking the right dashboard comes down to matching the tool to your specific situation.
Match Complexity to Your Skill Level
If you’re new to email marketing or only spend a few hours per week on campaigns, an overly complex dashboard will likely go unused. Simpler tools that surface the most important metrics often deliver more value than feature-packed platforms you never fully explore.
Compare Pricing and Value
Free tiers can be perfectly adequate for small lists and basic reporting. As your list grows, evaluate which features are unlocked at each pricing tier, since some platforms reserve their best analytics for higher-priced plans.
Check Integration Compatibility
Your email dashboard becomes significantly more useful when it connects with your existing tools. Before choosing a platform, confirm it integrates with your CRM, e-commerce system, or website analytics.
Align Metrics with Your Goals
An e-commerce business selling products cares about different KPIs than a B2B company focused on lead generation. Choose a dashboard that emphasizes the metrics most relevant to your business model.
Tip: Start with metrics that directly tie to revenue or your primary business goal, then expand your tracking from there.
Track Smarter and Simplify Your Email Marketing
The right email analytics dashboard transforms scattered data into a clear direction. Instead of guessing what works, you’ll know, and you can do more of it.
For marketers who want powerful insights without the complexity, Benchmark Email’s intuitive reporting dashboard delivers exactly that. You get the metrics you need, presented clearly, so you can spend less time analyzing and more time creating campaigns that connect.
Try Benchmark Email free and see how simple email analytics can be.

Sign up for a free Benchmark Email account today!
SIGN UP FREEFrequently Asked Questions
How often should I check my email analytics dashboard?
Review your dashboard within 24 to 48 hours after sending a campaign to catch early trends. After that initial check, a weekly review helps you track ongoing performance patterns without obsessing over daily fluctuations.
Can I track email analytics without affecting subscriber privacy?
Yes, most dashboards collect aggregate data rather than personal information about individual subscribers. Privacy-compliant platforms let you track engagement metrics while complying with regulations such as GDPR.
What are good benchmarks for email open rates and click-through rates?
Benchmarks vary significantly by industry. Rather than chasing universal averages, focus on improving your own rates over time. A 5% improvement in your click rate matters more than matching an arbitrary industry standard.
Are free email analytics dashboards enough for small businesses?
Free tiers typically cover essential metrics like opens, clicks, and bounces, which are often sufficient for small businesses getting started. As your list grows or you want advanced features like segmentation reporting, upgrading usually makes sense.
How do I turn email dashboard data into action?
Start by identifying your lowest-performing metric. Then test one specific change, such as a different subject line approach or a different send time, in your next campaign. Track whether that change improves the metric, and build from there.
About the Author:

High level marketing, technical email topics, email trends | Jessica Lunk is the VP of Growth Marketing at Benchmark Email, where she combines strategic flair with hands-on expertise to help busy marketers elevate their email game. Delivering timely insights on list hygiene, ROI, and email deliverability, she’s a go-to voice for practical marketing wisdom.