


Infographics are powerful visual communication tools. They have the ability to communicate information in an engaging way while holding the viewer’s attention and persuading them to act.
Bringing up infographics in a conversation likely leads to associations with creating brand awareness, increasing user engagement, and driving website traffic. What you may be surprised to hear is that infographics are also extremely effective in generating leads. In fact, conversion rates for brands that use visual content are seven times higher than those that don’t.
In this article, I’m going to explain how you can use infographics to generate qualified leads for your business.
1. Address a Pain Point
Picture this: a potential customer arrives on your website, browses around, and leaves without engaging with your content.
That’s a lost opportunity right there. To make them stay and convert them into a lead, you need to offer something meaningful.
Create an infographic that your target audience can derive value from. The infographic should address a pain point and imparts useful information while positioning your brand as the expert in the niche.
Here are some ways to find customer pain points:
- Conduct email surveys and original research.
- Speak to your sales and customer service teams.
- Do keyword research to find commonly asked questions in your niche.
- Browse relevant forums and online communities.
- Monitor social media comments and reviews.
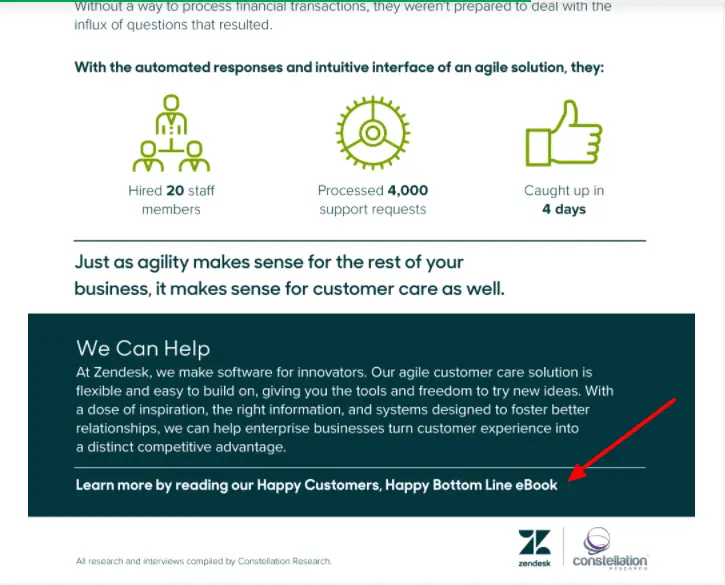
You can also create an infographic to supplement another content offer, such as an eBook or whitepaper. Take this infographic Zendesk created to drive traffic to their eBook and generate leads as an example.
(Source)
2. Craft a Compelling Title
There is a deluge of content online. The first step to making your infographic stand out is coming up with a compelling title that grabs your audience’s attention.
As Brian Dean suggests, the key is to keep the title “insanely specific.” Your readers need to know what they’ll derive from the infographic. Use the infographic title to demonstrate its usefulness.
Here are some tactics you can use to craft clickable titles:
- Keep it short and accurate.
- Include numbers and data.
- Use words that appeal to emotions.
- Consider negative superlatives. (eg. mistakes, stop, warnings, etc.)

(Source)
3. Keep the Design Simple
Check out this infographic:
(Source)
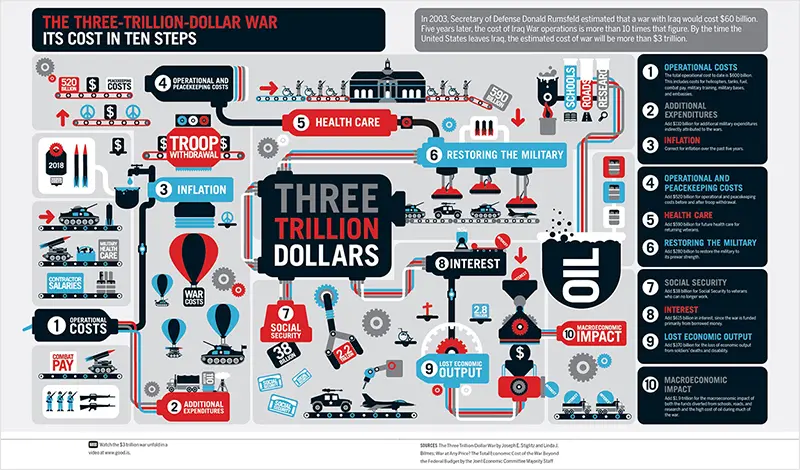
Its cluttered design fails to captivate readers, which won’t do much to impress (and convert) them.
Moral of the story: your infographic design plays a huge role in capturing attention and keeping readers engaged.
A well-designed infographic is one that is aesthetically pleasing and functional in its communication. What’s important is using visual content and keeping the design simple.
Here are some infographic design best practices to keep in mind:
- Create an outline and plan the flow of information.
- Pick the right infographic layout for your data.
- Use a grid design or wireframe to organize all the design elements.
- Include data visualizations to present data effectively. (eg. charts, tables, maps, etc.)
- Select 2-3 simple and legible fonts to create a hierarchy of information.
- Use icons, illustrations, and photos to complement the information.
- Choose a color scheme in line with your brand colors and infographic theme.
- Ensure there is enough negative or white space between the design elements.
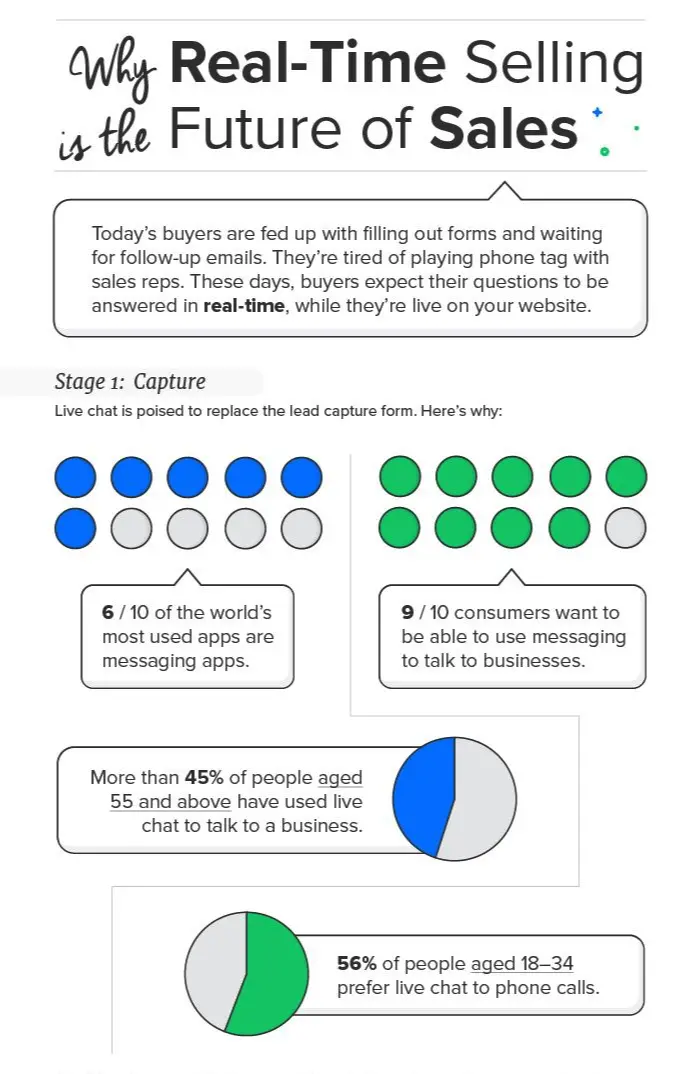
Take a look at this well-designed infographic by Drift. They’ve used icons and charts to communicate the data effectively while keeping the text minimal. It’s skimmable and easy to digest.
(Source)
Showcase the Infographic in a Blog Post
You’ve designed the infographic. Now the question is, how do you display and drive traffic to it?
One of the best ways to showcase your infographic and attract views is by writing a blog post around it. The idea is to create supporting content and expand upon the infographic.
Apart from offering additional value, this also gives you the opportunity to write SEO-optimized content that can help your blog post rank and attract traffic while driving views to the infographic.
Use the blog post to give background information and elaborate on all the subheadings you’ve covered in the infographic.
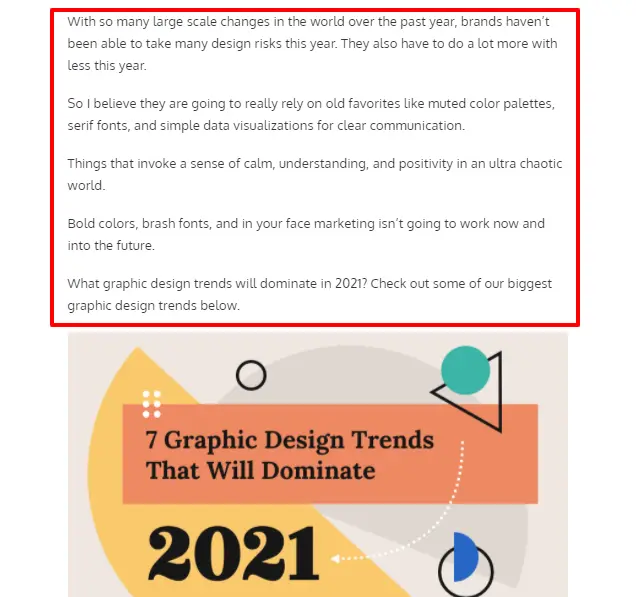
Here’s an example of a blog post Venngage created to showcase their infographic on graphic design trends. The post begins with a short introduction, displays the infographic, and does a deep dive into each of the trends.
(Source)
Optimize the Infographic for On-Page SEO
Let’s not forget that infographics are images. Google doesn’t read them the way it reads text, but that shouldn’t stop you from optimizing the infographic (and blog post) for on-page SEO.
The first step is to conduct keyword research. You can use free tools such as Google Keyword Planner to identify the target keyword(s). Make sure you narrow down on keywords with high search volume and low competition.
Once you’ve finalized the keyword, include it in the following places:
- Blog post headline
- Meta-description
- Blog post URL
- Infographic file name
- Infographic alt text
- Header tags (e.g., H1, H2, etc.)
- Include it organically across the blog post content
Keeping these on-page SEO best practices in mind will help your blog post (and infographic) rank better and attract quality traffic leading to a potential increase in leads.
Include a Strong Call-to-Action
You’ve managed to drive traffic to your blog post and have people view the infographic, but is that enough? Not quite.
You need to be able to convert those visitors into leads. So, don’t forget to place a powerful call-to-action in the blog post.
Make sure you use clear and specific action words for the call-to-action button that persuade people to click and maximize website conversions.
While you can place the call-to-action at the end of the blog post and infographic, you should also consider placing it in-text and align it with the content where it’s likely to make the most impact.
Here’s an example of an infographic blog post by HubSpot. Notice how they’ve seamlessly inserted their offer (6 Free Blog Post Templates) in the middle and end of the blog post.
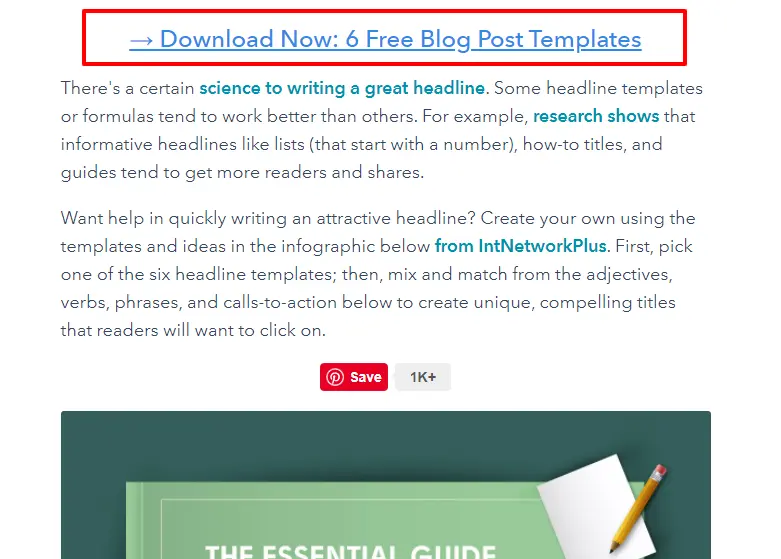
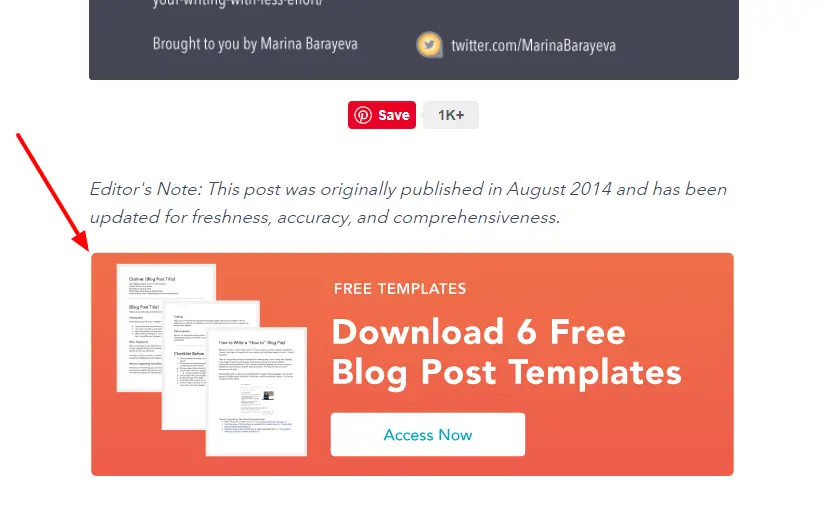
(Source)
Create Mini-Infographics for Social Media
We can all agree that creating infographics takes slightly more work than writing a blog post. After all the effort you put in, it’s equally important to promote your infographic across channels and boost visibility.
Speaking of content promotional channels, the first one that comes to mind is social media.
Promoting your infographic through organic and paid channels on social media will help you reach a wider audience, attract more traffic to your website, and amplify your lead generation efforts.
However, considering the length of most infographics, you can’t share them as is on social media because you’ll probably be left with cropped-out versions.
Take a look at this infographic posted on LinkedIn. You have to open the image in a new tab and zoom in to read it.

(Source)
The solution lies in creating social media infographics. All you have to do is break the long infographic into multiple bite-sized infographics, making them better suited for the size requirements of the different social media platforms.
This makes it easier to read the infographic. Make sure you add a link to the blog post or main infographic in the caption. This will help drive traffic to your website.
Here’s an example of a social media infographic posted by John Hopkins Medicine. They created a series of mini-infographics from a larger infographic and posted it as a carousel post on Instagram.

(Source)
Repurpose the Infographic for SlideShare
As a B2B marketer, SlideShare is a content distribution platform you can’t afford to miss.
With over 70% of traffic coming from targeted search, this platform poses the potential to amplify reach and attract qualified leads.
The good news is that on SlideShare, infographics are four times more viral than presentations. This gives you all the more reason to repurpose your infographic into a SlideShare deck.
Condense the information on the infographic and break it down into smaller slides. Make sure every slide is focused on one key takeaway and is complemented with visuals in the form of illustrations, icons, charts, graphs, photos, etc.
That’s not all; you can also place a lead form in the middle or at the end of the SlideShare deck and encourage people to convert without leaving the platform.
Partner With Other Brands
You don’t always have to create infographics on your own. You can also partner with other brands that speak to a similar target audience and co-create the infographic.
This is a cost-effective tactic, helping you tap into your partner’s audience and expand your reach. For instance, here’s a snippet of an infographic Spark Post created in partnership with Survey Monkey.
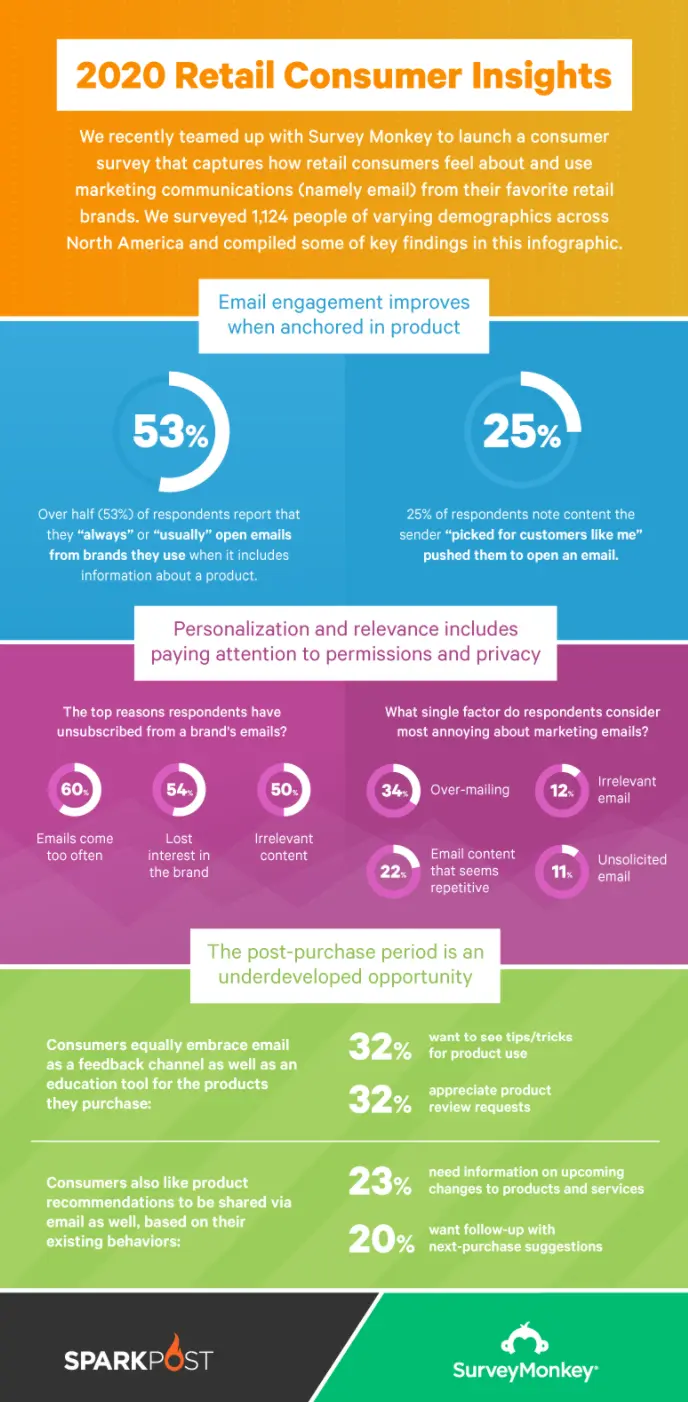
(Source)
The Takeaway: Boost Lead Generation with Infographics
The next time you’re developing a lead generation campaign, instead of falling back on long-form content offers such as eBooks, guides, and whitepapers, give infographics a try.
These nine effective tactics will help you create a compelling infographic that will not only educate your audience but will also amplify your lead generation efforts.
Author Bio

Adela Belin is a content marketer and blogger at Writers Per Hour. She is passionate about sharing stories with the hope to make a difference in people’s lives and contribute to their personal and professional growth. Find her on Twitter and LinkedIn.

A powerfully simple email marketing platform
Sign up for free to see how effortless email marketing can be.
Our Company
Compare
Solutions
Compare
Account
© Polaris Software, LLC Benchmark Email® is a registered trademark of Polaris Software, LLC
© Polaris Software, LLC
Benchmark Email® is a registered trademark of Polaris Software, LLC